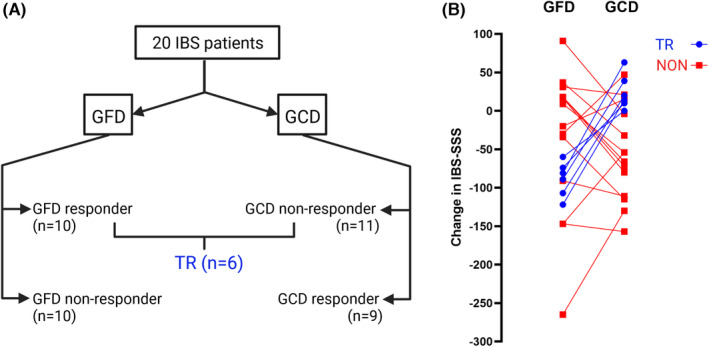
FIGURE 2.

Flow chart of responses to both gluten‐free diet (GFD) and gluten‐containing diet (GCD). (A) Six IBS patients responded to the gluten‐free intervention and did not respond to the gluten‐containing intervention and were identified as true responders (TR), and all others (n = 14) were identified as non‐responders (NON). (B) individual changes in IBS‐SSS during both GFD and GCD.
