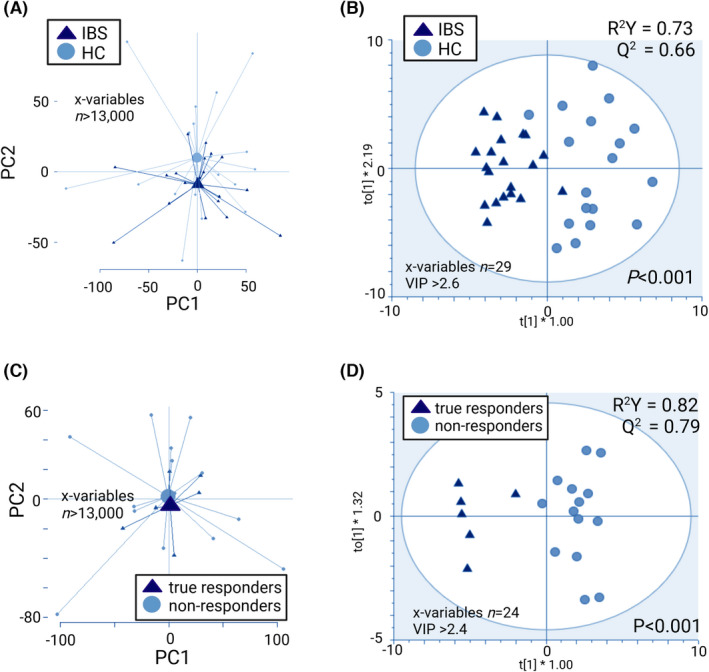
FIGURE 4.

Effects of a 2‐week gluten‐free diet on fold changes (after/before gluten‐free intervention) in metabolites of faecal supernatants (LC–MS), shown as PCA scatterplots with centroids ( A and C) and OPLS‐DA scatterplots (B and D). The R 2 Y value determines goodness of the fit and the Q 2 value represents the predictive ability of the model; R 2 Y ≥ 0.5 and Q 2 ≥ 0.4 are considered satisfactory. Permutation tests for (B) and (D) showed no overfitting. IBS (n = 20), HC (n = 18), true responders (n = 6) and non‐responders (n = 14).
