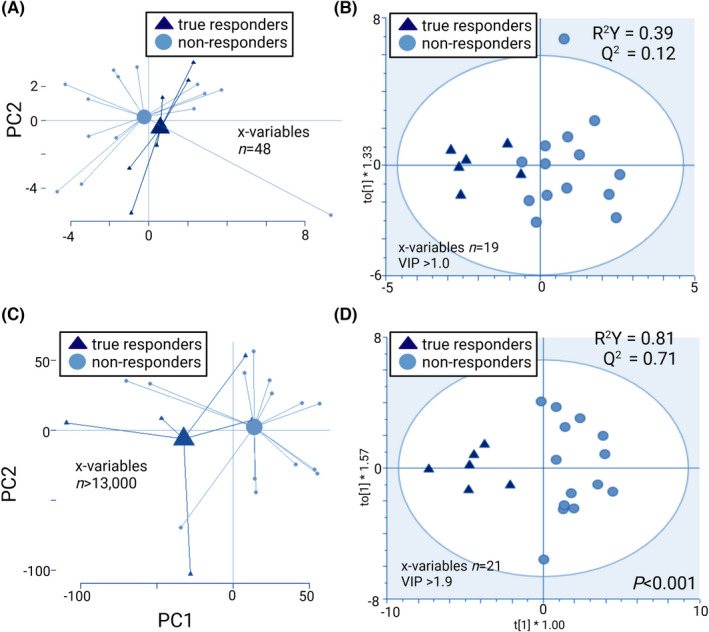
FIGURE 5.

Prediction of response to gluten‐free diet in IBS, assessed before the gluten‐free intervention. Faecal microbiota profiles (GA‐map™ dysbiosis test) shown as PCA scatterplot with centroids (A), and OPLS‐DA scatterplot (B). Metabolite profiles of faecal supernatants (LC–MS) shown as PCA scatterplot with centroids (C), and OPLS‐DA scatterplot (D). The R 2 value determines goodness of the fit and the Q 2 value represents the predictive ability of the model; R 2 Y ≥ 0.5 and Q 2 ≥ 0.4 are considered satisfactory. Permutation test for (D) showed no overfitting. True responders (n = 6) and non‐responders (n = 14).
