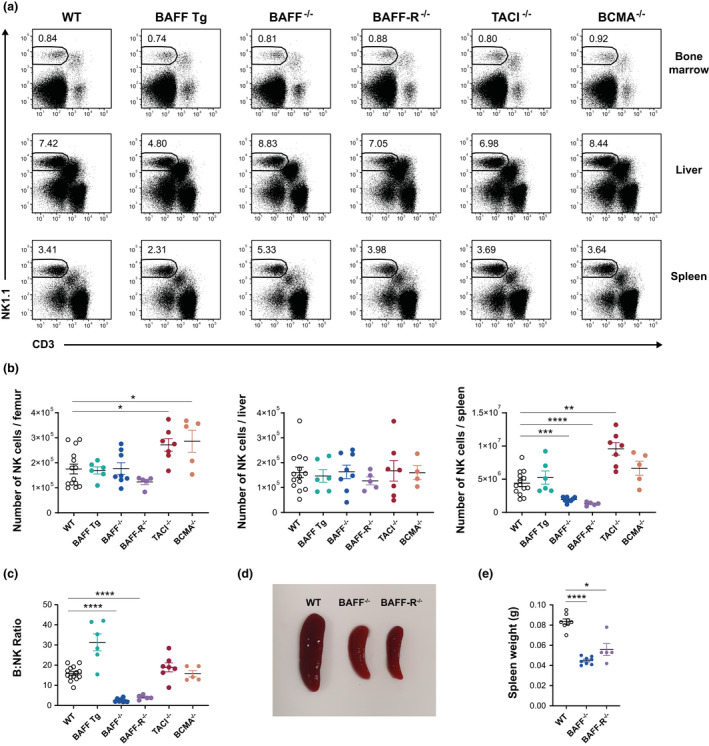
Figure 1.

Phenotypic analysis of NK cells in the BM, liver and spleen of BAFF Tg, BAFF−/−, BAFF‐R−/−, TACI−/− and BCMA−/− mice compared with WT controls. The NK population was identified as CD19−CD3−NK1.1+ cells. (a) Representative plots showing the mean percentages of live NK cells in WT and GM mice at three anatomical locations. (b) Absolute numbers of NK cells in the BM, liver and spleen of WT and GM mice. (c) The ratio of B to NK cells in each spleen, calculated as the number of B cells divided by the number of NK cells. (d) Relative size and (e) weight of spleens isolated from WT, BAFF−/− and BAFF‐R−/− mice. Data are shown as means ± standard error of the mean, and each symbol represents the results from a single mouse. All data are representative of two or three independent experiments; n = 4–14 mice; *P ≤ 0.05, **P ≤ 0.01, ***P ≤ 0.001, ****P ≤ 0.0001. BAFF, B‐cell–activating factor; BAFF‐R, B‐cell–activating factor receptor; BCMA, B‐cell maturation antigen; BM, bone marrow; GM, genetically modified; NK, natural killer (cells); TACI, transmembrane activator and calcium modulator and cyclophilin ligand interactor; Tg, transgenic; WT, wild type.
