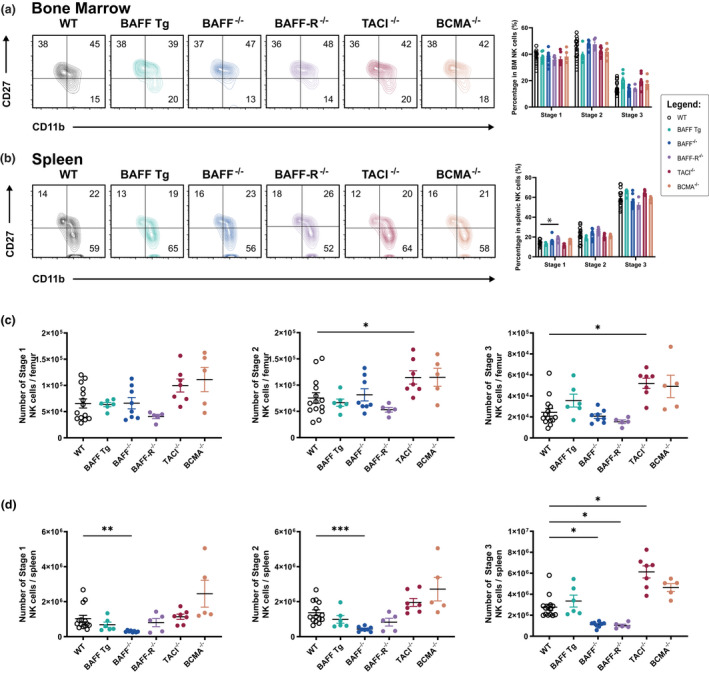
Figure 2.

The distribution and population sizes of NK cell subsets including Stage 1 (CD11blowCD27high), Stage 2 (CD11bhighCD27high) and terminally differentiated Stage 3 cells (CD11bhighCD27low). The distribution of NK cell subsets in the (a) BM and (b) spleens of WT and GM mice. The numbers within the FACS plots in a and b are the mean percentages of each CD3−NK1.1+ population as a function of the total NK cell population. Absolute numbers (means ± standard error of the mean) of cells of each NK subset in the (c) bone marrow and (d) spleen. Each symbol represents the findings from one mouse. The GM mice were age and gender matched to the WT controls. All data shown are representative of at least two independent experiments with n = 5–14 mice per strain; *P ≤ 0.05, **P ≤ 0.01, ***P ≤ 0.001. BAFF, B‐cell–activating factor; BAFF‐R, B‐cell–activating factor receptor; BCMA, B‐cell maturation antigen; BM, bone marrow; FACS, fluorescence‐activated cell sorting; GM, genetically modified; NK, natural killer (cells); TACI, transmembrane activator and calcium modulator and cyclophilin ligand interactor; Tg, transgenic; WT, wild type.
