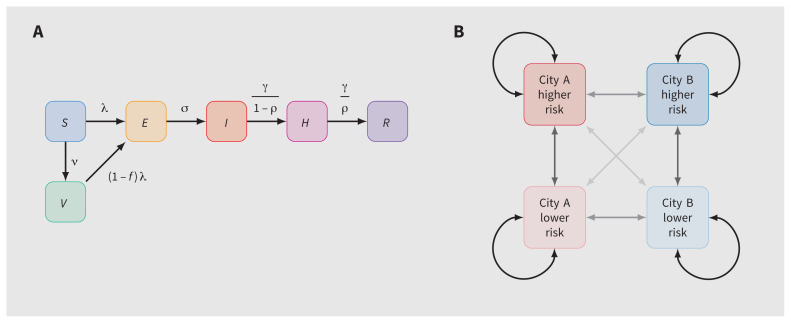
Figure 1:
Model structure. (A) Health states and transitions. (B) Cities, risk groups and contact networks. Note: E = exposed, H = isolating, I = infectious, R = recovered, risk = risk of monkeypox virus infection or transmission, defined by numbers of sexual partners (definitions in Appendix 1, available at www.cmaj.ca/lookup/doi/10.1503/cmaj.221232/tab-related-content), S = susceptible, V = vaccinated. Arrow opacity is qualitatively related to the chance of sexual contact formation from any group to another (higher opacity reflects a greater chance of contact). Rate definitions can be found in Appendix 1, Section A (model details).

