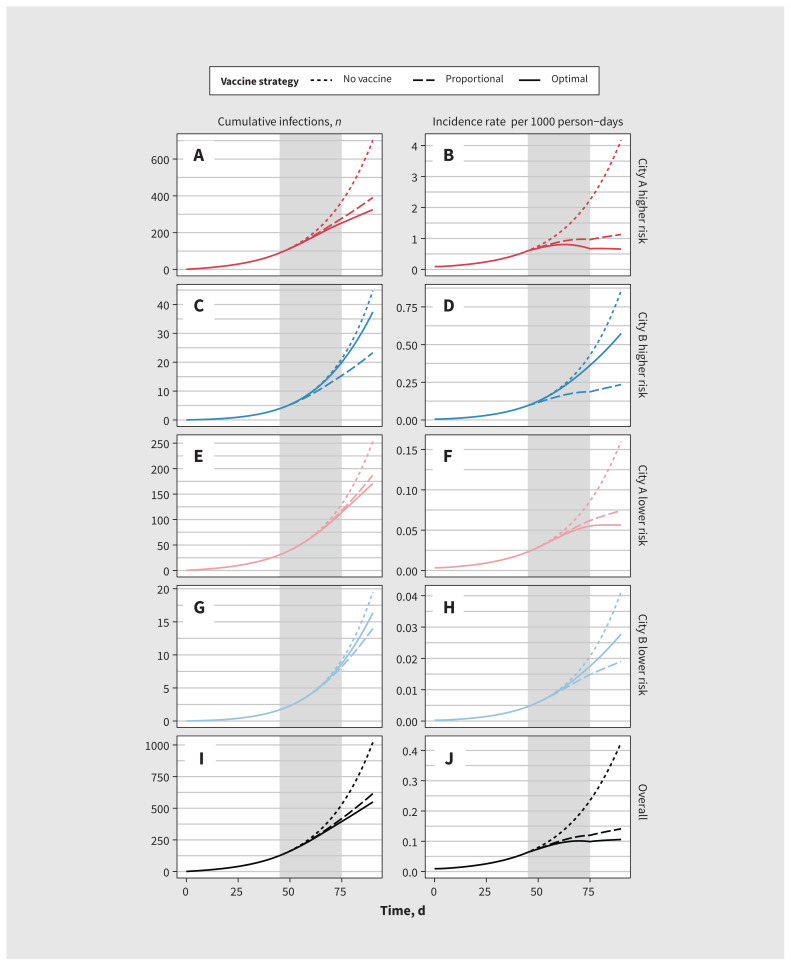
Figure 2:
Modelled monkeypox virus (MPXV) cumulative infections and incidence rate in 2 cities under 3 different vaccine allocation scenarios. Gray bar indicates the period of vaccine roll-out (days 45–75). City A reflects a Toronto-like city and city B reflects a medium-sized city in Ontario. For vaccine allocation, proportional allocation (to city size) was 75% to city A and 25% to city B, and optimal allocation (most infections averted by day 90) was 100% to city A. Note: Risk = risk of MPXV infection or transmission, defined by numbers of sexual partners (definitions in Appendix 1, available at www.cmaj.ca/lookup/doi/10.1503/cmaj.221232/tab-related-content).

