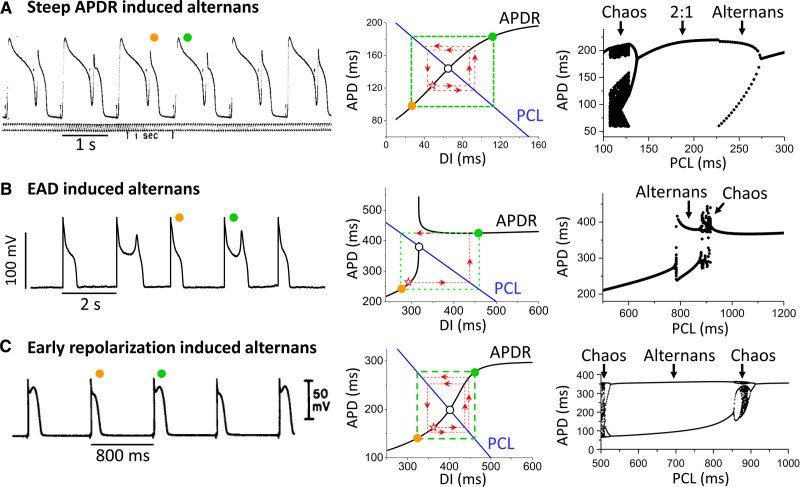
Figure 2.
Voltage-driven alternans. A, Steep action potential duration restitution (APDR)-slope–induced action potential duration (APD) alternans. B, Early afterdepolarization (EAD)-induced APD alternans. C, Early repolarization-induced APD alternans. Left, Experimental action potential (AP) recordings for the 3 cases, obtained from frog ventricle by Nolasco and Dhalen (A),31 a rabbit ventricular myocyte with hypokalemia-induced EADs (B),45 and canine epicardial ventricular muscle during simulated ischemia-induced early repolarization (C).49 Middle, APDR curves for the 3 cases obtained from corresponding computer simulations.12,32,47 The intersection of the APDR curve (black) and pacing cycle length (PCL) line (blue) is the equilibrium point (open circle). If the slope of the APDR curve at this point is >1, the equilibrium point is unstable. Using the graphical cobweb approach pioneered by Nolasco and Dhalen,31 starting from an initial APD and diastolic interval (DI; star symbol), the subsequent APD and DI values alternate in a growing pattern (red dashed lines and arrows), eventually reaching steady-state APD alternans (green dashed box and colored circles). Right, Corresponding plots of APD versus PCL for the 3 cases.12,32,47 For each PCL, more than 20 consecutive APDs are superimposed. Two APD values at the same PCL indicate alternans, and many APD values indicate high periodicity or chaos.

