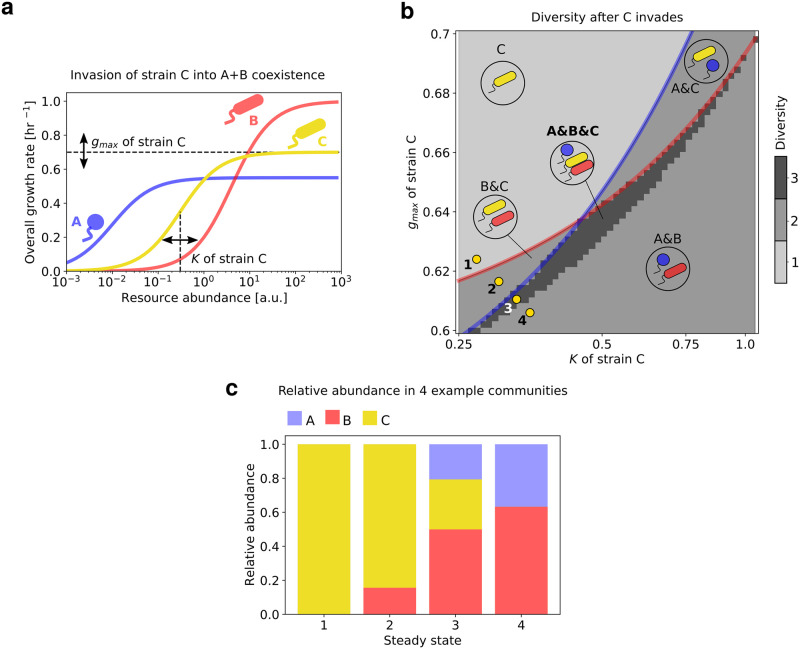
Fig 2. Three-strain coexistence in a boom and bust environment on a single resource.
(a) Growth rate profiles of strains A, B and C, which all obey Monod growth. We fixed the parameters gmax and K for strains A (blue) and B (red), and varied them for strain C in a manner that both gC and KC remained between those of strains A and B. (b) Heatmap showing the steady state community diversity (number of coexisting strains) as a function of the growth parameters gC and KC. In the region above the solid blue line, A goes extinct, above the red line, B goes extinct. The yellow dots represent 4 variants of C corresponding to 4 qualitatively distinct steady state community compositions, shown as stacked bar plots of relative abundances in (c).

