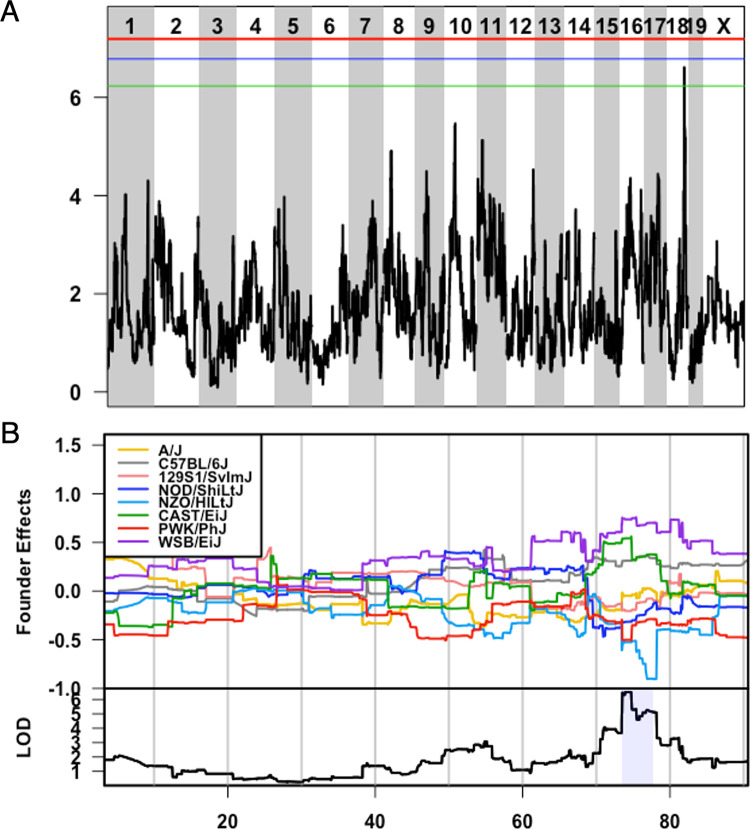
Fig 3. Qih1 identified for variation in homeostatic IgG1 levels is driven by B6, WSB, and CAST haplotypes.
A) LOD plot showing QTL significance (y-axis) across the genome (x-axis) with significance thresholds (genome-wide p-value = 0.05 (red), 0.1 (blue), 0.2 (green)). Qih1 associated allele effects (A/J = yellow, B6 allele = grey, 129S1 allele = pink; NOD allele = dark blue; NZO allele = light blue; CAST = green; PWK = red; WSB = purple) were determined for the associated peak. B) Allele effect plot shows the mean deviation from population-wide mean as on the upper Y-axis for each allele segregating in the CC across the QTL peak region (x-axis positions are megabases on the chromosome) Highlighted region is the QTL confidence interval determined by a 1.5 LOD drop.

