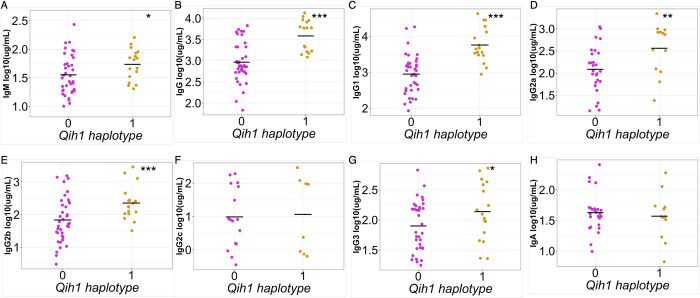
Fig 4. Qih1 shows broad effects across antibody isotypes and subtypes.
We assessed the relationship between B6, WSB, and CAST haplotypes (Qih1 haplotype = 1) and serum concentrations of (A) IgM, (B) total IgG, (C) IgG1, (D) IgG2a, (E) IgG2b, (F) IgG2c, (G) IgG3, and (H) IgA. Each point represents the mean value for each CC strain and the mean for each haplotype group on the x-axis is denoted by the grey crossbar. (*p < 0.1, **p < 0.05, ***p < 0.01) p-values determined using nested linear model approach described in the methods.

