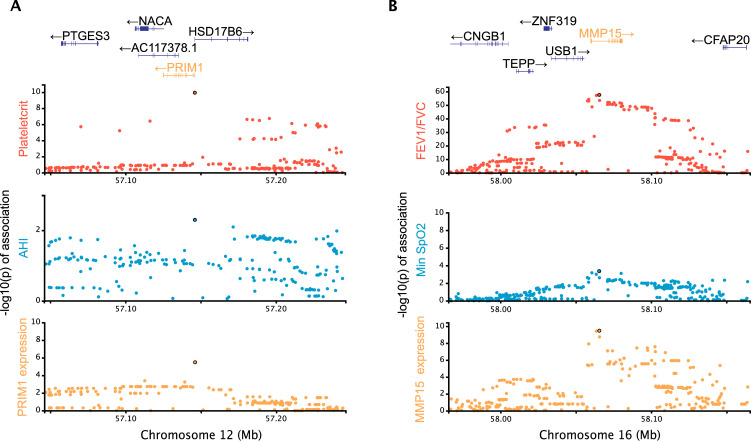
Fig 3. Candidate causal chains linking a clinical trait, OSA trait and gene expression.
A) A candidate association in chromosome 12 with putative pleiotropic associations between the plateletcrit (clinical trait; red), AHI (OSA trait; blue) and expression of PRIM1 (DNA primase subunit 1) in monocytes (yellow). B) A candidate association in chromosome 16 with putative pleiotropic associations between the clinical trait FEV1/FVC (red), minimum O2 saturation (blue) and expression of MMP15 (matrix metallopeptidase 15) in lung (yellow).

