
Fig. 4. ARES learns to identify key characteristics of RNA structure that are not specified in advance.
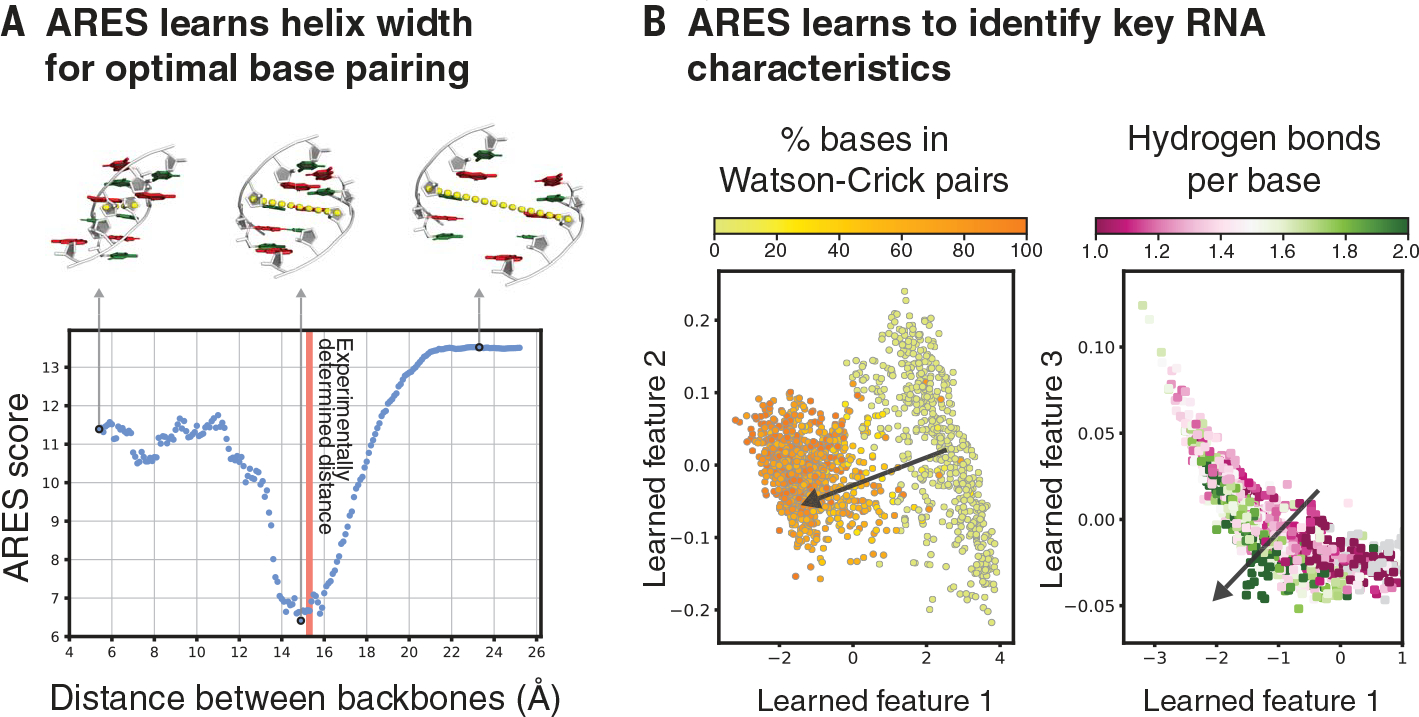
(A) As the distance between two complementary strands of an RNA double helix is varied, ARES assigns the best scores when the distance closely approximates the experimentally observed distance (red vertical line). The distance is measured between the C-4′ atoms of the central base pair (yellow dotted lines). (B) ARES’s learned features separate RNA structures according to the fraction of bases that form Watson-Crick pairs (left) and the average number of hydrogen bonds per base (right). The arrow in each plot indicates the direction of separation. Learned features 1, 2, and 3 are the first, second, and third principal components, respectively, of the activation values of the 256 nodes in ARES’s penultimate layer across 1576 RNA structures. Each dot corresponds to one of these structures (12).