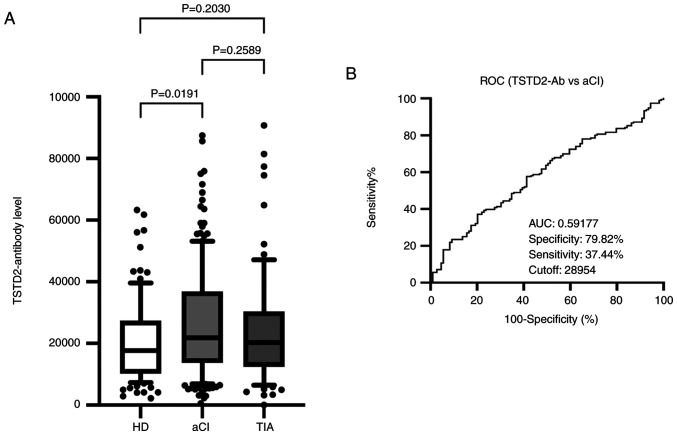
Figure 2.
Comparison of the serum levels of TSTD2 antibodies in HDs, and in patients with aCI and TIA. (A) The figure illustrates the levels of serum TSTD2-Abs examined using amplified luminescence proximity homogeneous assay (Alpha)-linked immunosorbent assay. Antibody levels are represented by Alpha photon counts and shown in a box-whisker plot. The horizontal lines represent medians, and the boxes represent the 25 and 75th percentiles. The whiskers represent the 10 and 90th percentiles, and the dots represent outliers. P-values were calculated using the Kruskal-Wallis test. A ROC curve analysis was performed to assess the ability of serum TSTD2-Abs to detect aCI. (B) The numbers in the graph are the AUC, specificity, sensitivity and cutoff values for the marker levels. TSTD2, thiosulfate sulfurtransferase-like domain-containing 2; TSTD2-Ab, TSTD2 antibody; HD, healthy donor; aCI, acute cerebral infarction; TIA, transient ischemic attack; ROC, receiver operating characteristic; AUC, area under the curve.

