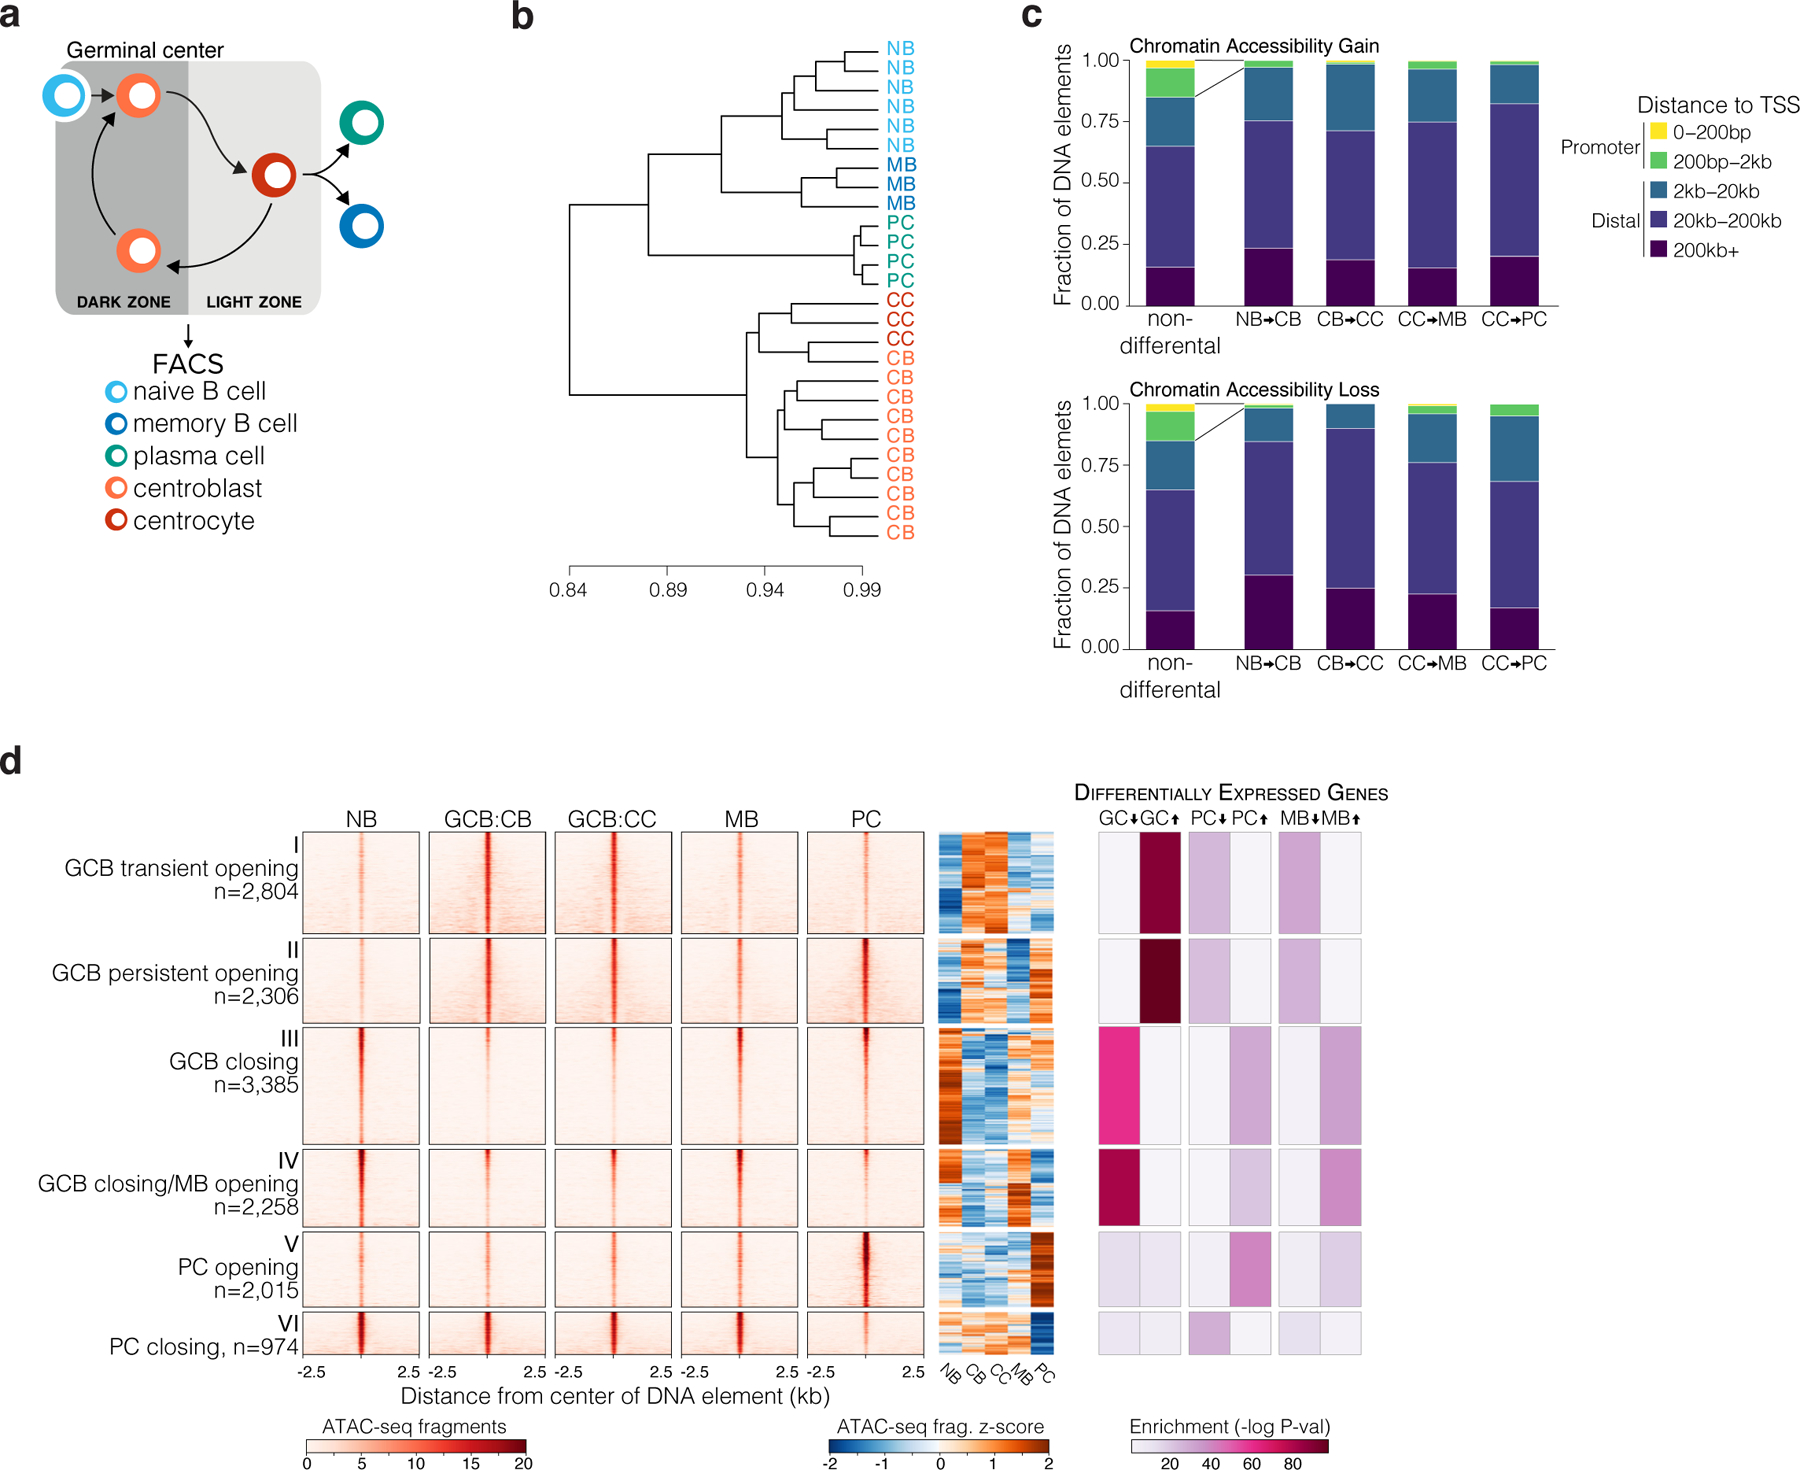
Figure 1. An Atlas of differentially accessible DNA elements defines B cells transiting the humoral immune response.

a, Illustration of cell fate transitions during the humoral immune response for B-cell populations isolated by FACS for sequencing studies. b, unsupervised hierarchical clustering dendrogram of distal DNA element chromatin accessibility across biological replicate B cell populations. NB: naïve B cell (n=6); CB: GCB centroblast (n=10); CC: GCB centrocyte (n=2); PC: plasma cell (n=4); MB: memory B cell (n=3). c, Bar plot showing the fractional proportion of elements according to genomic distance to nearest gene transcription start site for all non-differential DNA elements or differentially accessible sites that increase (top) or decrease (bottom) in accessibility during the indicated cell type transition. d, ATAC-seq insertion heat maps centered on K-means clustered (k=6) differentially accessible DNA elements (n= 13,658 sites) for the transitions indicated in (c), and enrichment of differentially expressed genes as determined by RNA-seq for genes with nearest gene TSS to respective DNA elements. Enrichment P values were computed by Fisher’s exact test with False Discovery Rate correction. RNA-seq was performed using at least 3 biological replicates per B-cell population.
