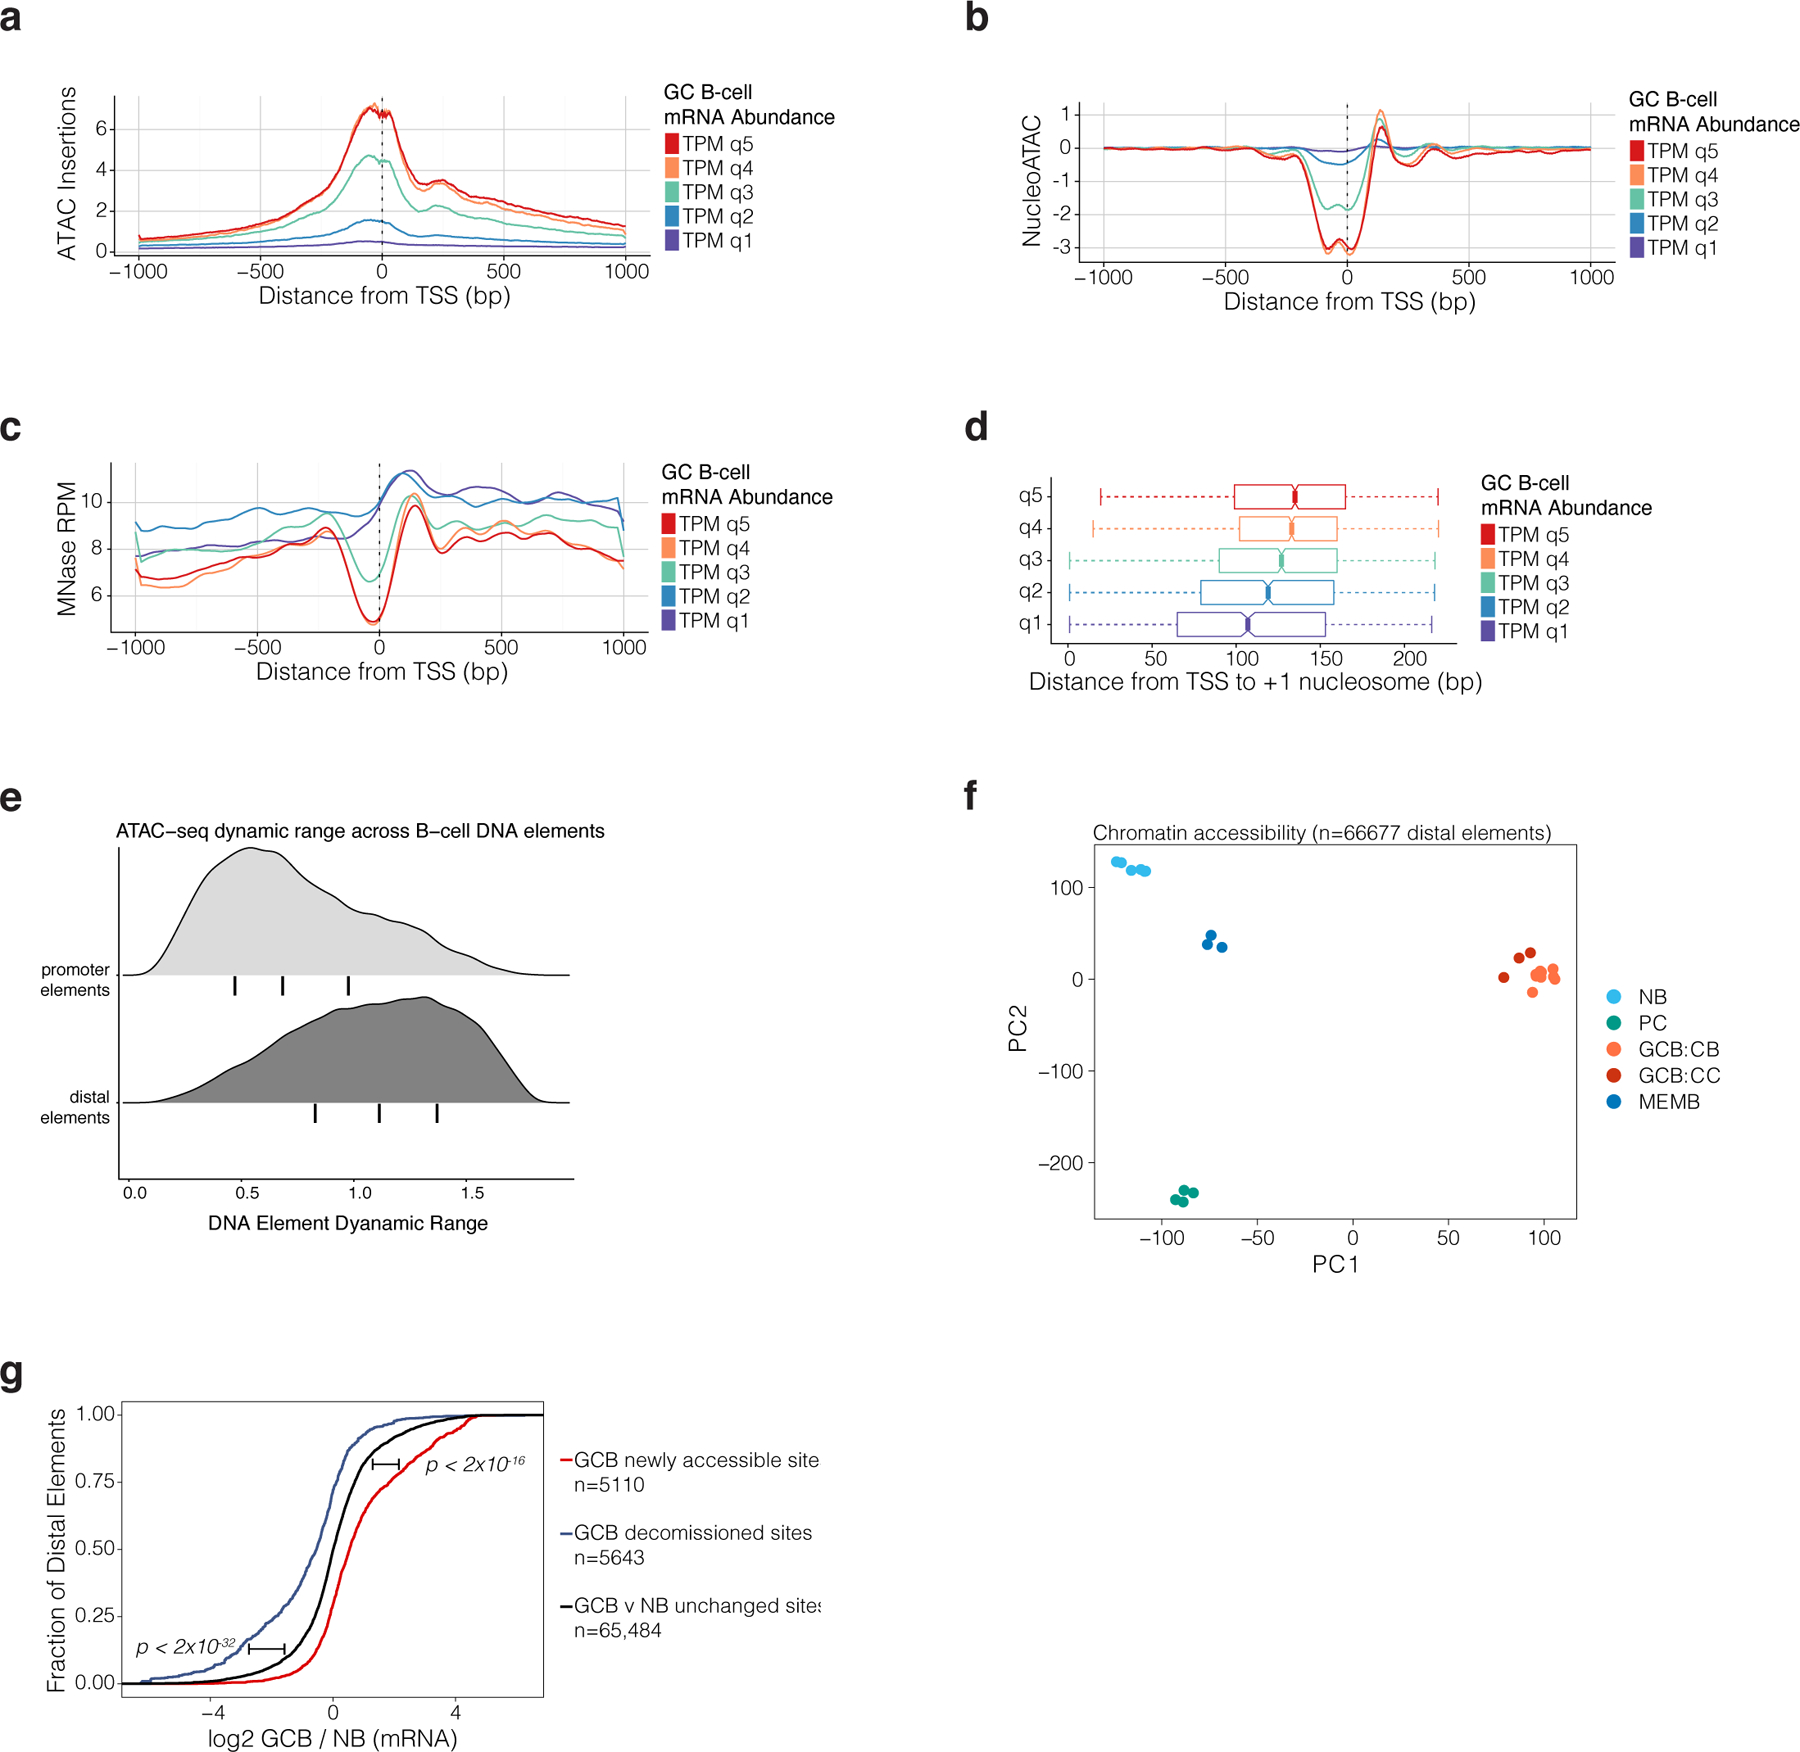
Extended data Figure 2.

related to Figure 1. a, ATAC-seq insertion profiles in GCBs for 2kb regions centered on gene transcription start sites. Mean profile is shown for genes by quintile of mRNA abundance in GCBs. mRNA abundance represented as TPM (transcripts per kilobase million) as estimated by Salmon46. b, NucleoATAC42 estimates of nucleosome position and occupancy for gene TSS according to a gene’s mRNA abundance quintile in GCBs. c, MNAse-seq reads per million mapped reads (RPM) according to a gene’s mRNA abundance quintile in GCBs. d, NucleoATAC estimates for the position of +1 nucleosome relative to the TSS of genes according to a gene’s mRNA abundance quintile in GCB (n=10 biological replicates). e, Density plots showing dynamic range of normalized ATAC-seq read counts in ATAC-seq peak-atlas sites across B-cell populations. Promoter elements are located <2kb from a gene TSS. Bars under density plots indicate inter-quantile range. f, principal components analysis (PCA) of ATAC-seq insertion counts in gene-distal peak-atlas elements across B cell populations. g, Cumulative probability distribution plot of GCB (n=13) vs NB (n=9) gene expression log2-fold changes (RNA-seq) for genes assigned to DNA elements that are differentially accessible (FDR<0.01) or unchanged in GCB (n=10) vs NB (n=6). Gene expression log2 fold changes are computed using DESEq247. P-values are calculated by Wilcoxon rank-sum test and bars adjacent to p-values indicate the comparison of newly accessible or decommissioned sites to unchanged sites.
