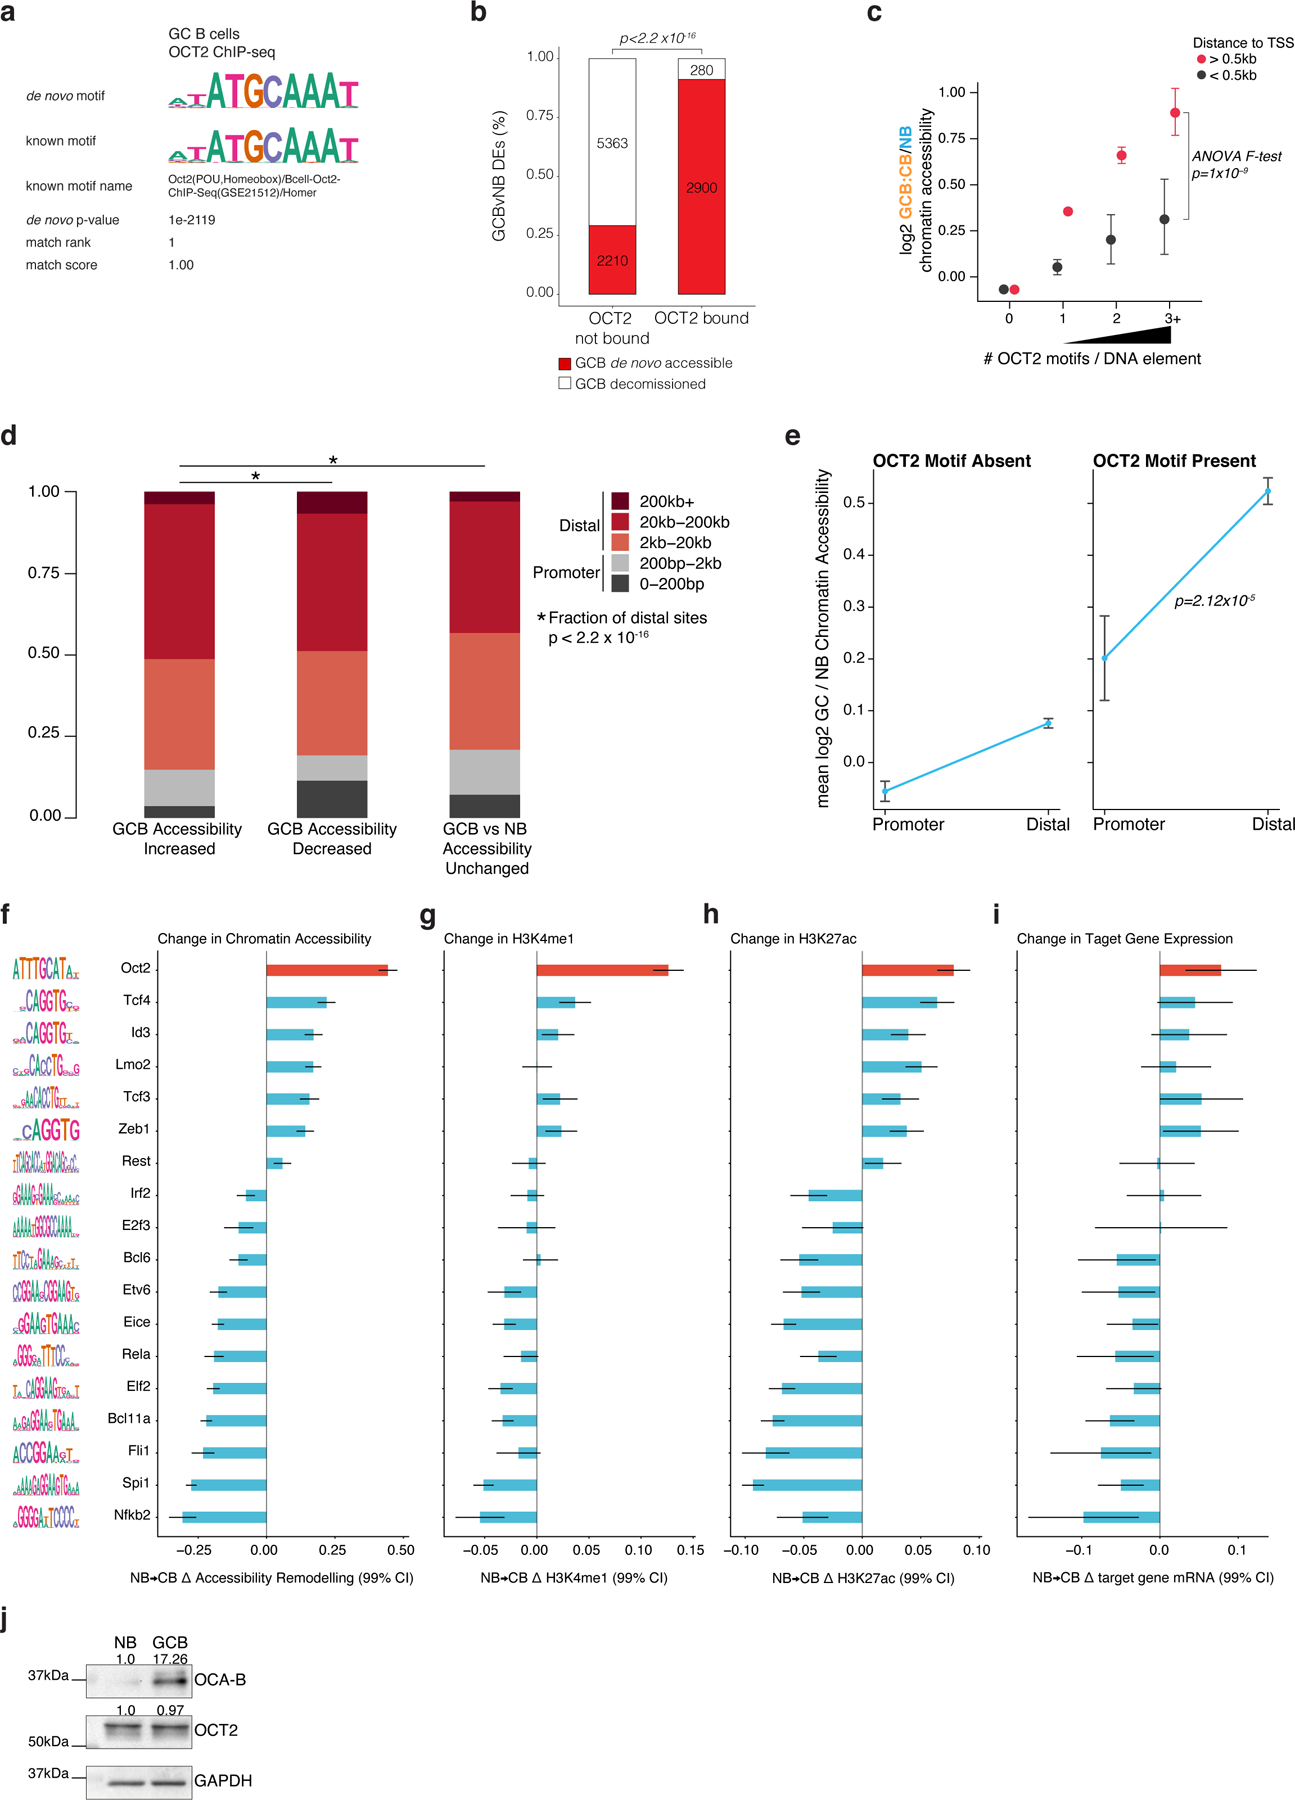
Extended data Figure 3.

related to Figure 2. a, results of de novo motif discovery using GCB OCT2 peak summits as input to HOMER48. b, bar plot of the relative fraction of differentially accessible elements that are GCB de novo accessible or GCB decommissioned in sites not bound by OCT2 and sites bound by OCT2. Number of sites is indicated in each bar plot. P-value computed by Fisher’s exact test. c, scatter plot of Bayesian posterior mean log2 fold-change in chromatin accessibility for GCB (n=10 biological replicates) vs NB (n=6 biological replicates) at sites with 0, 1, 2, or >=3 OCT2 motifs, and distinguishing sites within 0.5kb of a gene TSS. P-value computed by ANOVA F-test. Error bars indicate 99% credible intervals. d, bar plot showing the fractional proportion of elements according to genomic distance to nearest gene transcription start site for DNA elements with differentially increased, decreased, or unchanged accessibility in mouse GCB (n=10 biological replicates) vs NB (n=4 biological replicates) (FDR<0.001). P-value computed by Fisher’s exact test. e, scatter plot showing the mean accessibility log2 fold-change in mouse GCB (n=10 biological replicates) relative to mouse NB (n=4 biological replicates) promoter and distal DNA elements lacking an OCT2 DNA motif or with an OCT2 DNA motif present. P-value computed by ANOVA for testing the null hypothesis that the difference in accessibility log2 fold-changes between promoter and distal elements does not depend on the presence of an OCT2 DNA motif. Error bars indicate 95% CIs. f, TF accessibility remodeling scores representing linear regression effect size estimates for TF motifs on the change in ATAC-seq chromatin accessibility in mouse GCB (n=4) relative to mouse NB (n=4). Error bars represent 95% CIs. Motif logos representing motif position weight matrices used to map TF motifs are plotted at left. g, TF motif linear regression effect size estimates for histone H3K4me1 log2 fold-changes in biological replicate GCBs (n=4) relative to NBs (n=4). Error bars represent 95% CIs. h, TF motif linear regression effect size estimates for histone H3K27ac log2 fold-changes in biological replicate GCBs (n=4) relative to NBs (n=4). Error bars represent 95% CIs. i, TF motif effect estimates for gene expression log2 fold-changes in mouse GCB (n=7) relative to NB (n=6). Genes assigned to DNA elements according to nearest TSS. Error bars represent 95% CIs. j, western blot for OCAB and OCT2 in human NBs and GCBs. Protein lysates were resolved by SDS–PAGE, transferred to PVDF membrane and probed with primary antibodies to the following: OCAB/BOB-1/OBF-1 (1:100, Cell Signaling Technology #33483S) and OCT2 (1:500, Thermo Scientific #RB-9297) and GAPDH (1:10000, Santa Cruz, sc-25778). Membranes were then incubated with corresponding HRP-conjugated secondary antibodies, and signal was detected using enhanced chemiluminescence (ChemiDoc Touch, Bio-Rad Laboratories). This blot was repeated independently with similar results for two biological replicate samples.
