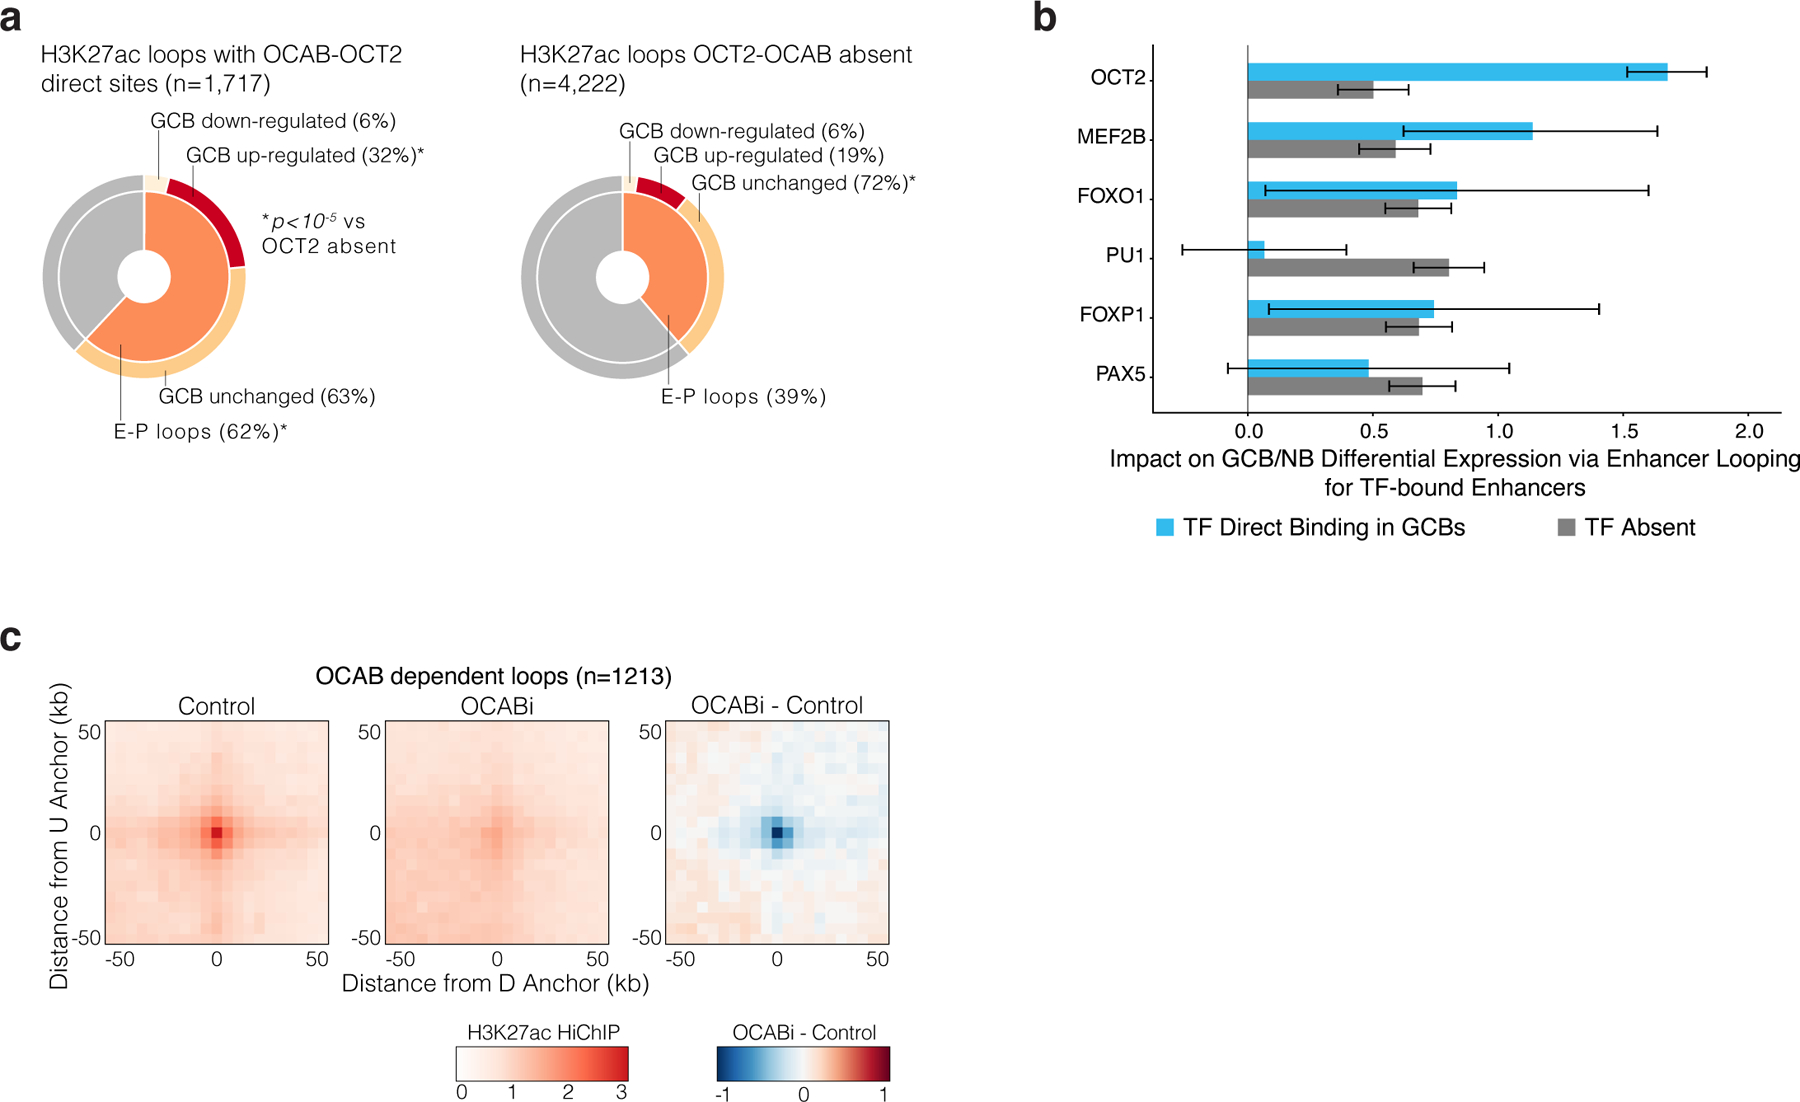
Extended data Figure 8.

related to Figure 6. a, pie chart showing the fraction of H3K27ac HiChIP loops that form enhancer-promoter (E-P) contacts for loops anchored by an OCAB-OCT2 sites (left) or not anchored by an OCAB-OCT2 site (right). The inner circle represents the fraction of loops that form E-P contacts, and the outer circle distinguishes whether the promoter belongs to a gene whose expression is differentially increased, decreased, or unchanged in GCB vs NB. *Indicates significantly greater fraction for OCT2-OCAB loops compared to loops not anchored by OCT2-OCAB. P-values by Fisher’s exact test and * indicates FDR-corrected p<10-5. b, effect estimates for the contribution of enhancer activity score to a gene’s change in expression in biological replicate GCBs (n=6) relative to NBs (n=6) for enhancers with direct binding present or direct binding absent for the indicated TF. Effect sizes were computed from a linear regression of GCB / NB expression log2 fold-change on the total enhancer activity score per gene for enhancers with and without TF direct binding, and error bars show 95% CI for mean effect estimate. Activity-contact score was computed from OCI-Ly7 H3K27ac HiChIP (n=2 biological replicates), GCB H3K27ac ChIP-seq (n=4 biological replicates), and using the 76237 ATAC-seq DNA elements identified in B cells. c, APA plots showing aggregate contact enrichment vs local background in Control and OCABi OCI-Ly7 cells and the difference in contact enrichment between OCABi and Control. Plots centered on anchor mid-points of called loops that were sensitive to OCAB depletion at 1% FDR.
