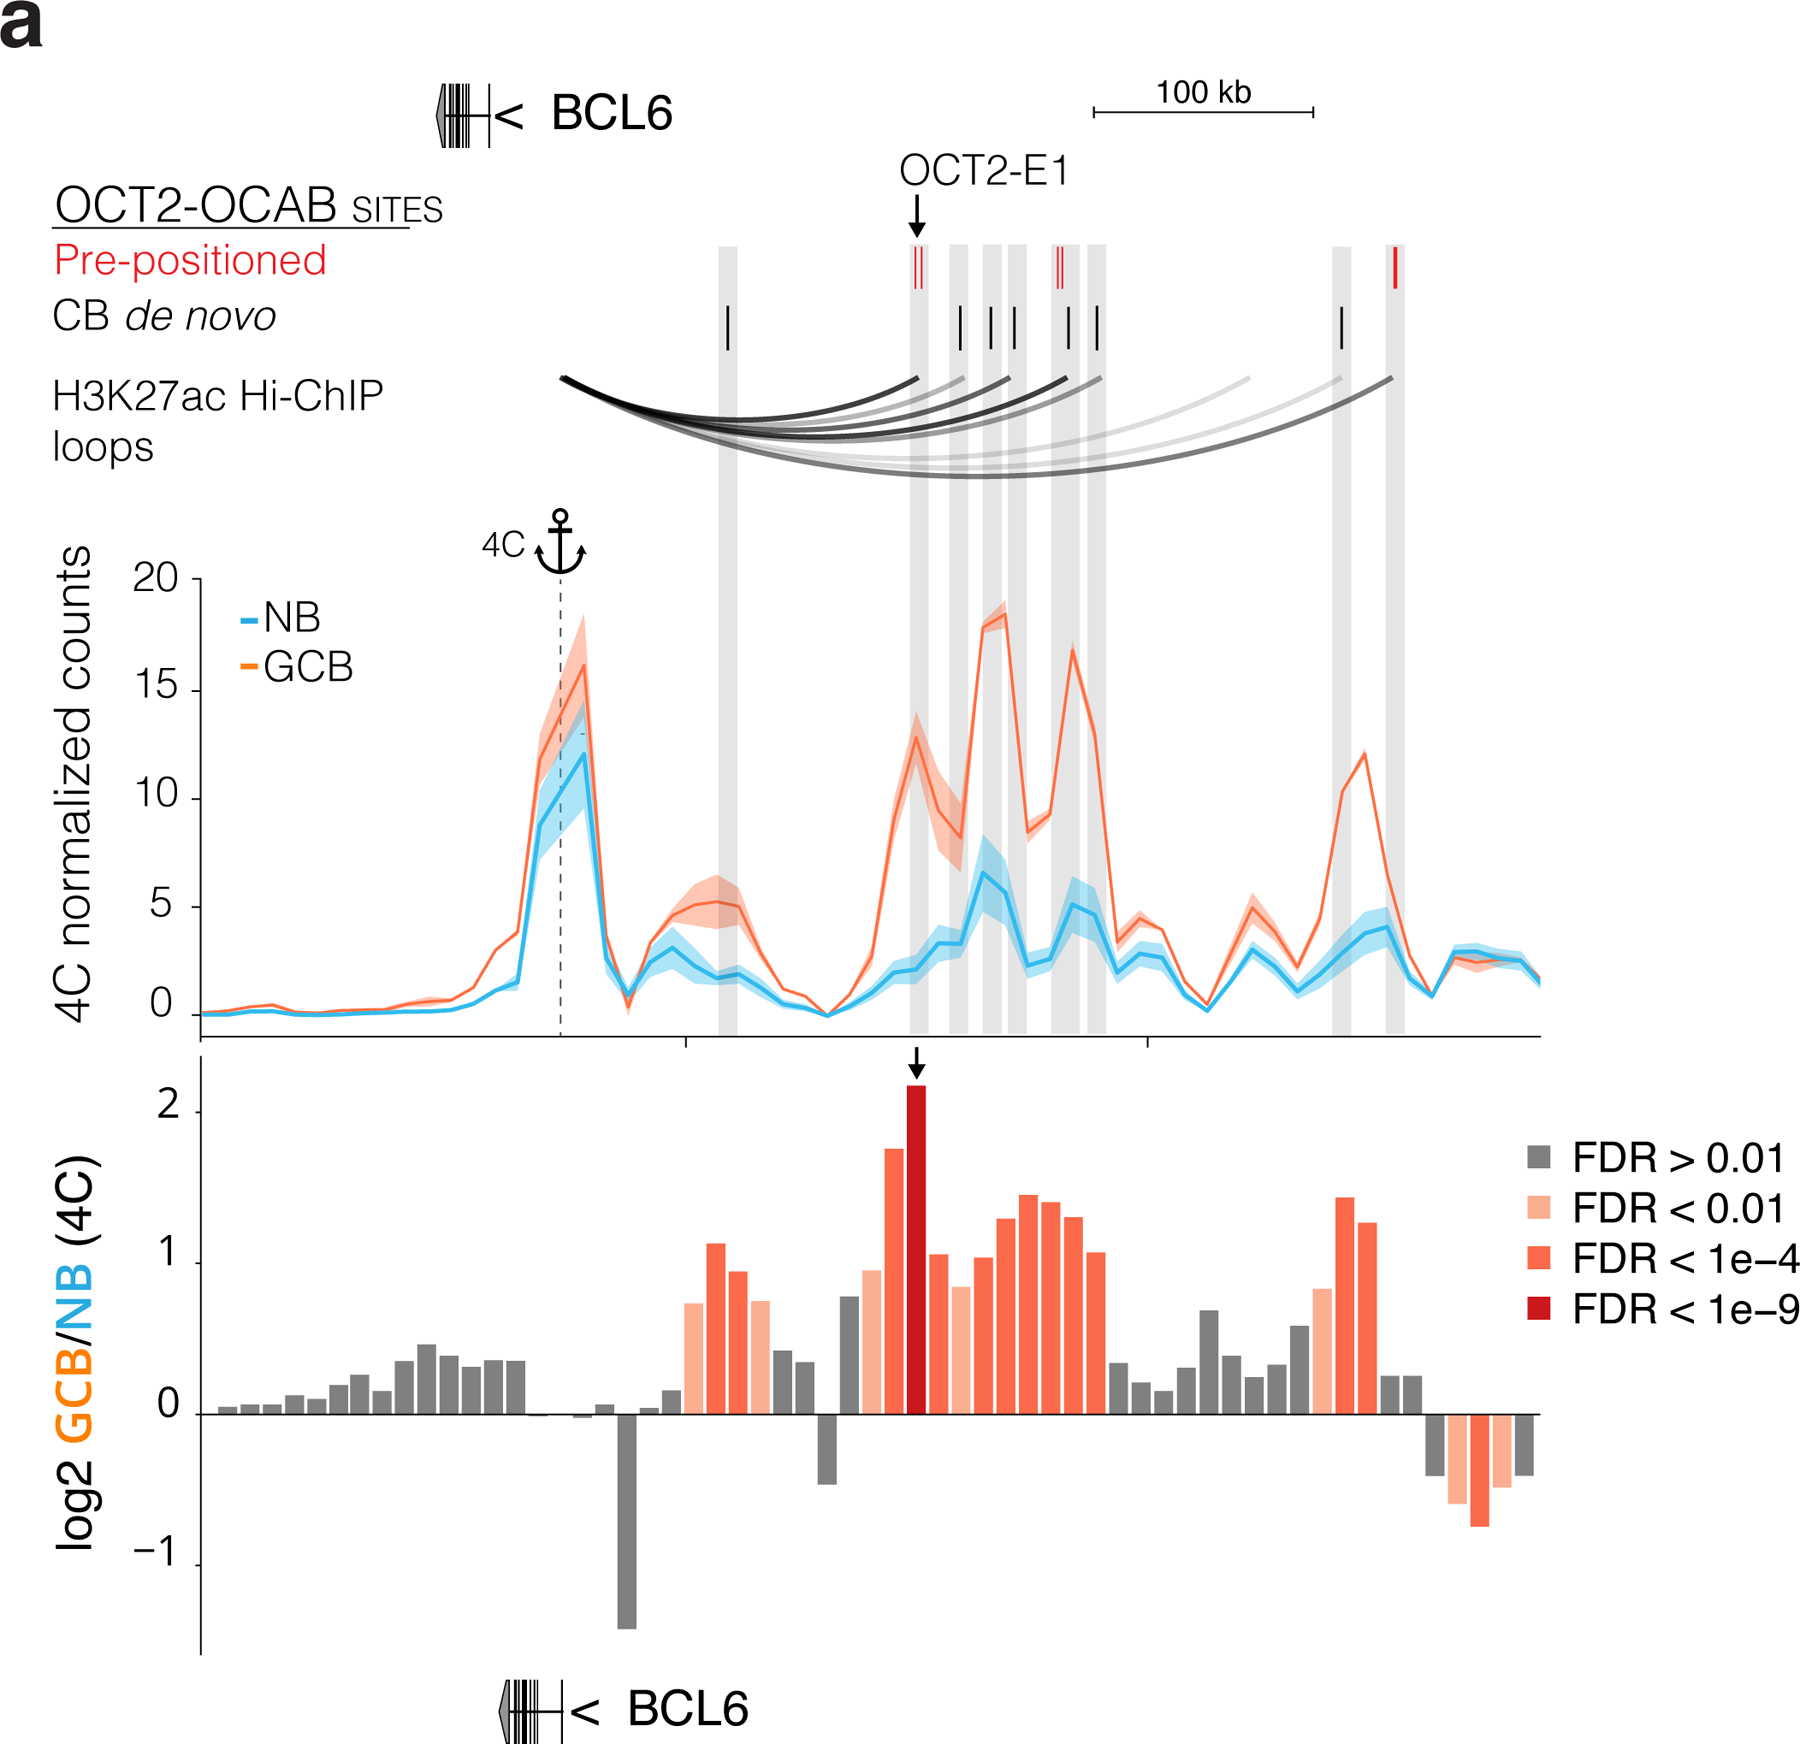
Extended data Figure 10.

related to Figure 8. a, genome browser plot of a region on chromosome 3 containing BCL6 and adjacent super-enhancer. OCT2-OCAB sites are shown with Pre-positioned OCT2 sites in red and GCB de novo OCT2 sites in black. H3K27ac HiChIP called loops in OCI-Ly7 cells. Plot showing NB and GCB 4C contact enrichment representing interactions with the 4C anchor, located at the BCL6 TSS. Bar plot showing differential 4C contact enrichment with bars labeled according to FDR for differential contacts. Normalized and differential contact enrichment computed using 4C-ker44 and DESeq247.
