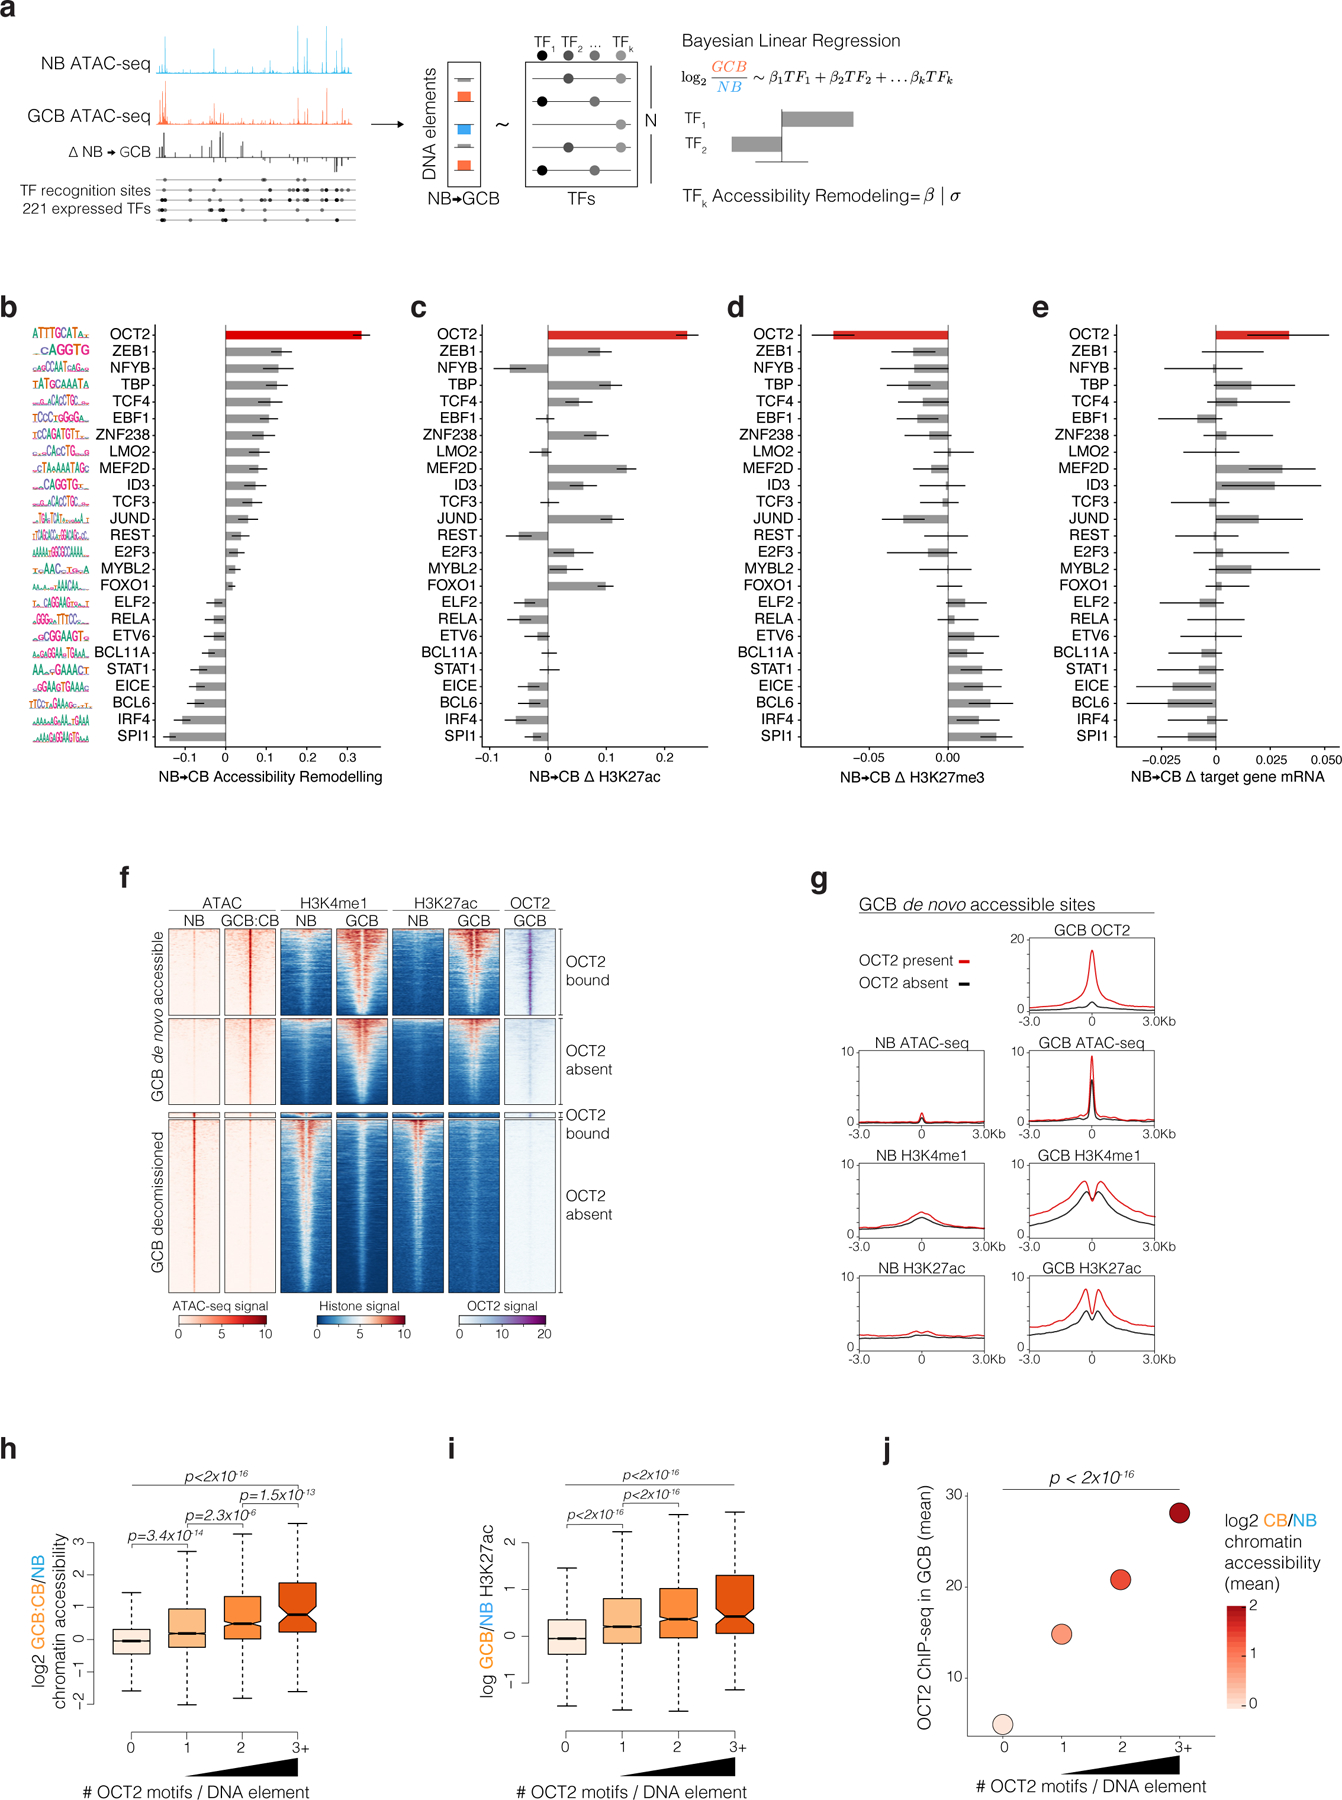
Figure 2. De novo chromatin accessibility in GC B-cells is most strongly linked to DNA elements bound by OCT2.

a, Strategy to quantify TF accessibility remodeling in GCBs relative to NBs. The top significant TFs identified from individual regressions of accessibility changes on TF DNA motifs are included in a Bayesian multiple linear regression using horseshoe regularization. Posterior means for the coefficients of each TF motif defines the TF accessibility remodeling score. b, bar plot of GCB vs NB accessibility remodeling scores for expressed TFs using gene-distal DNA elements (n=66,677). Motif logos (left) represent position weight matrices used to map motifs in accessible sites. c, TF motif multiple regression effect estimates for histone H3K27ac log2 fold-changes in biological replicate GCBs (n=4) relative to NBs (n=4) across gene-distal DNA elements (n=66,677). d, TF motif Bayesian multiple regression effect size estimates for repressive H3K27me3 log2 fold-changes in biological replicate GCBs (n=3) relative to NBs (n=3) across gene-distal DNA elements (n=66,677). e, TF motif multiple regression effect size estimates for nearest TSS gene expression log2 fold-changes in biological replicate GCBs (n=6) relative to NBs (n=6). f, ATAC-seq insertion and ChIP-seq enrichment (signal/input) heatmaps centered on differentially accessible elements (DAEs) in GCB vs NB. OCT2-bound DAEs contain an OCT2 ChIP-seq peak in GCBs. g, density plots centered on GCB de novo accessible sites comparing OCT2 binding in GCBs and H3K4me1 abundance, H3K27ac abundance and ATAC-seq insertions in NBs and GCBs. h, Box plot of GCB vs NB accessibility and H3K27ac (i) log2 fold-changes for elements containing 0 (n=57627), 1 (n=7799), 2 (n=1110) or >=3 (n=141) OCT2 motifs. Pair-wise comparison adjusted P values computed by Tukey’s test and P values (top) computed by type II ANOVA. j, Bayesian regression posterior estimates for accessibility log2 fold-changes (color scale) and GCB OCT2 ChIP-seq enrichment at DNA elements with indicated number of OCT2 recognition sequences. P values are computed by type II ANOVA. Box plot center lines represent medians, box limits indicate upper/lower quartiles, whiskers are minimum/maximum values within 1.5 x inter-quartile range of 1st and 3rd quartile, and notches approximate 95% confidence intervals (CI) of the median.
