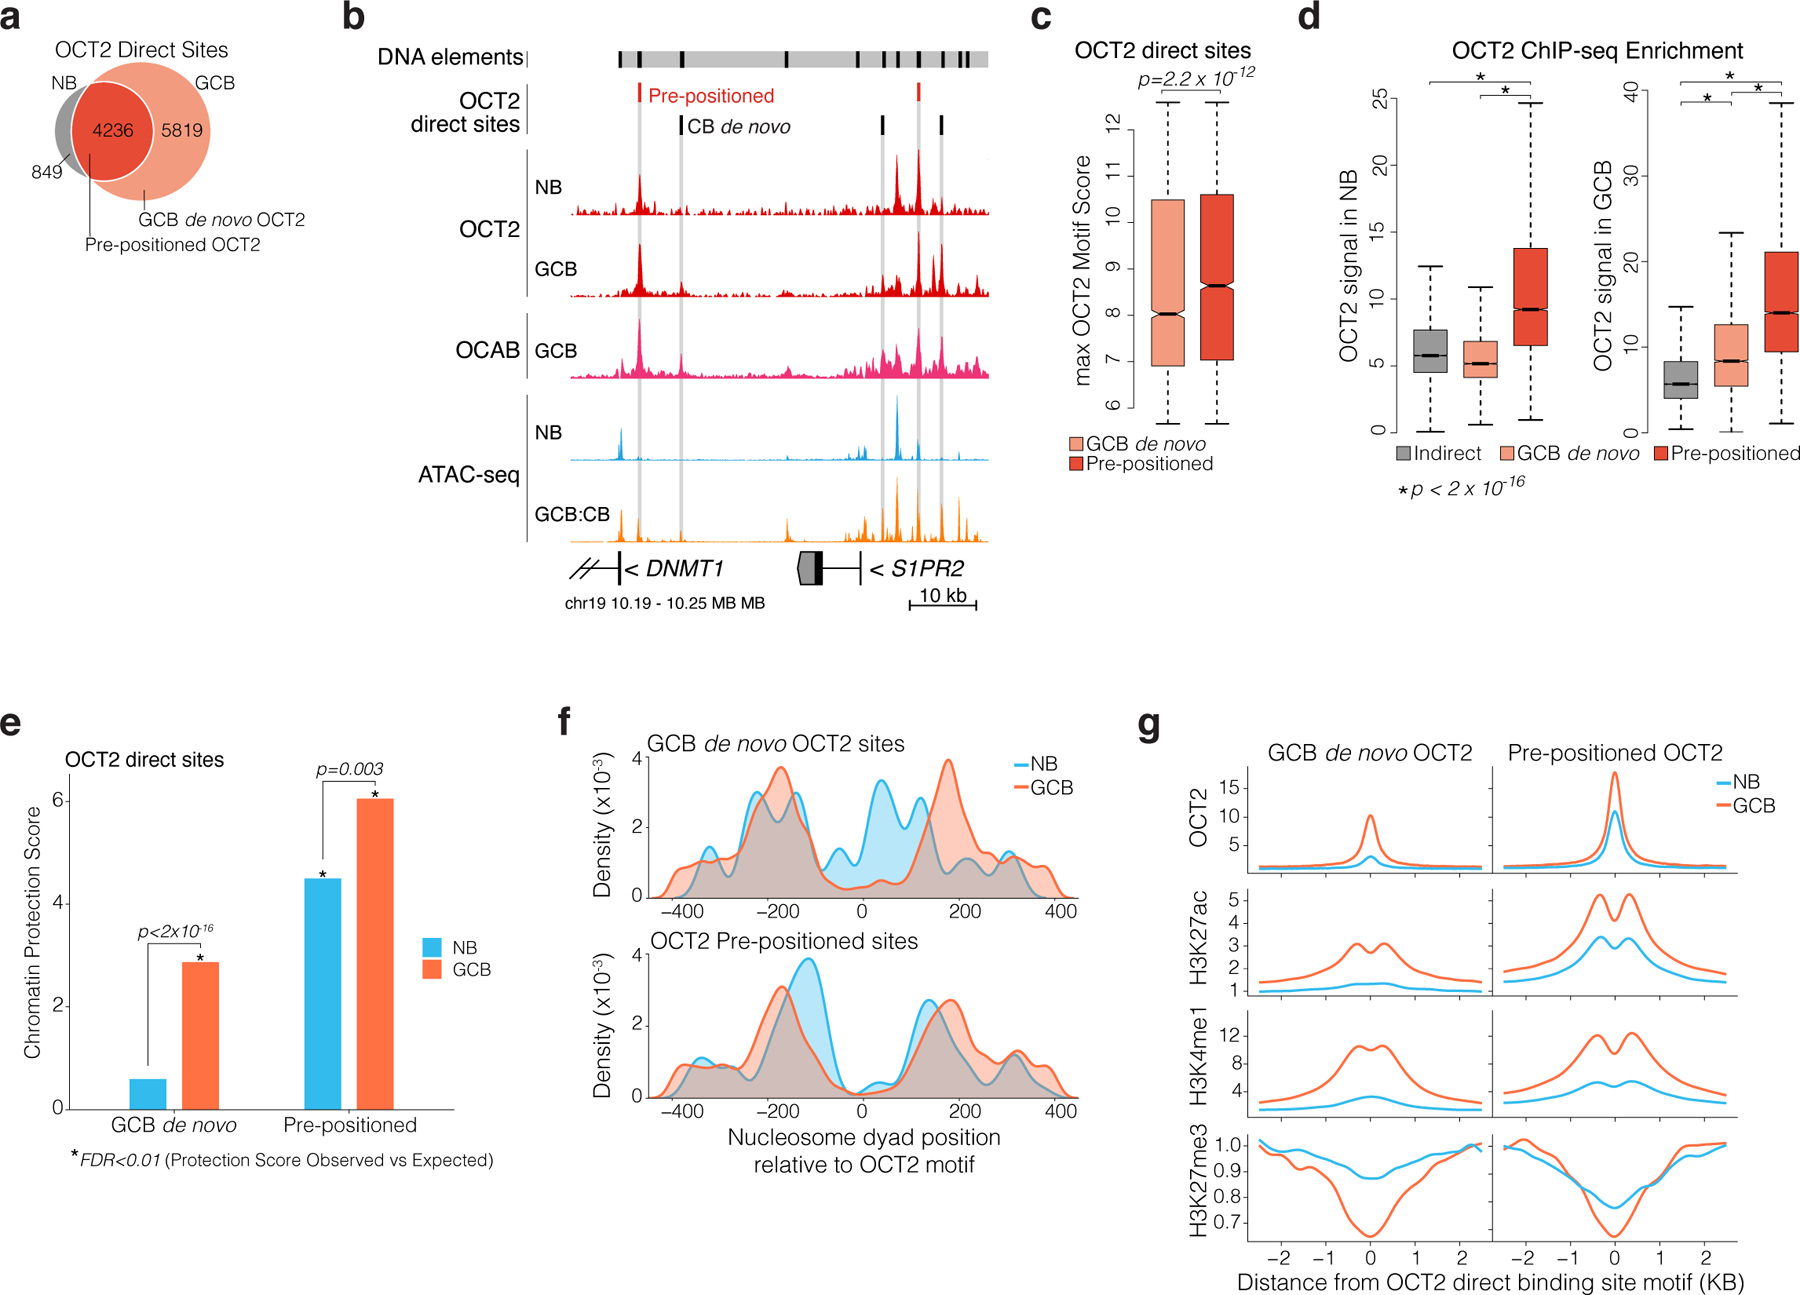
Figure 3. Gain of chromatin accessibility is preprogrammed by OCT2 in naïve B cells.

a, Venn diagram of OCT2 ChIP-seq peak overlap in NBs and GCBs. Direct sites contain an OCT2 DNA motif. OCT2 pre-positioned sites refer to direct sites bound by OCT2 in NBs and GCBs. b, genome browser tracks for OCT2 and OCAB ChIP-seq enrichment, normalized ATAC-seq insertions, and OCT2 direct sites in NBs and GCBs. Y-axis scale is identical across all ATAC-seq samples and all ChIP-seq samples. c, boxplot comparing maximum OCT2 motif score in pre-positioned (n=4236) and GCB de novo (n=5819) OCT2 binding sites. P value is computed by Mann-Whitney U-test. D, boxplot comparing OCT2 ChIP-seq enrichment/input in NBs and GCBs across OCT2 indirect (n=3732), pre-positioned (n=4236), and GCB de novo (n=5819) sites. **indicates p<2×10⁻¹⁶ by Mann-Whitney U-test. E, Barplots comparing ATAC-seq chromatin protection scores computed using HINT22 for GCB de novo and pre-positioned OCT2 sites in NBs and GCBs. P values are computed by Mann-Whitney U-test. *indicates sites with significant observed vs. expected protection at 1% false discovery rate. f, density plots of NB and GCB nucleosome dyad positions relative to OCT2 DNA motif in pre-positioned and GCB de novo OCT2 sites in NBs and GCBs. Nucleosome position and occupancy are computed from ATAC-seq data using NucleoATAC42. g, read density plots of ChIP-seq enrichment/input for OCT2, H3K27ac, H3K4me1, and H3K27me3 in GCBs and NBs at pre-positioned and GCB de novo OCT2 sites. Box plots center lines represent medians, box limits indicate upper/lower quartiles, whiskers are minimum/maximum values within 1.5 x inter-quartile range of 1st and 3rd quartile, and notches approximate 95% CI of the median.z
