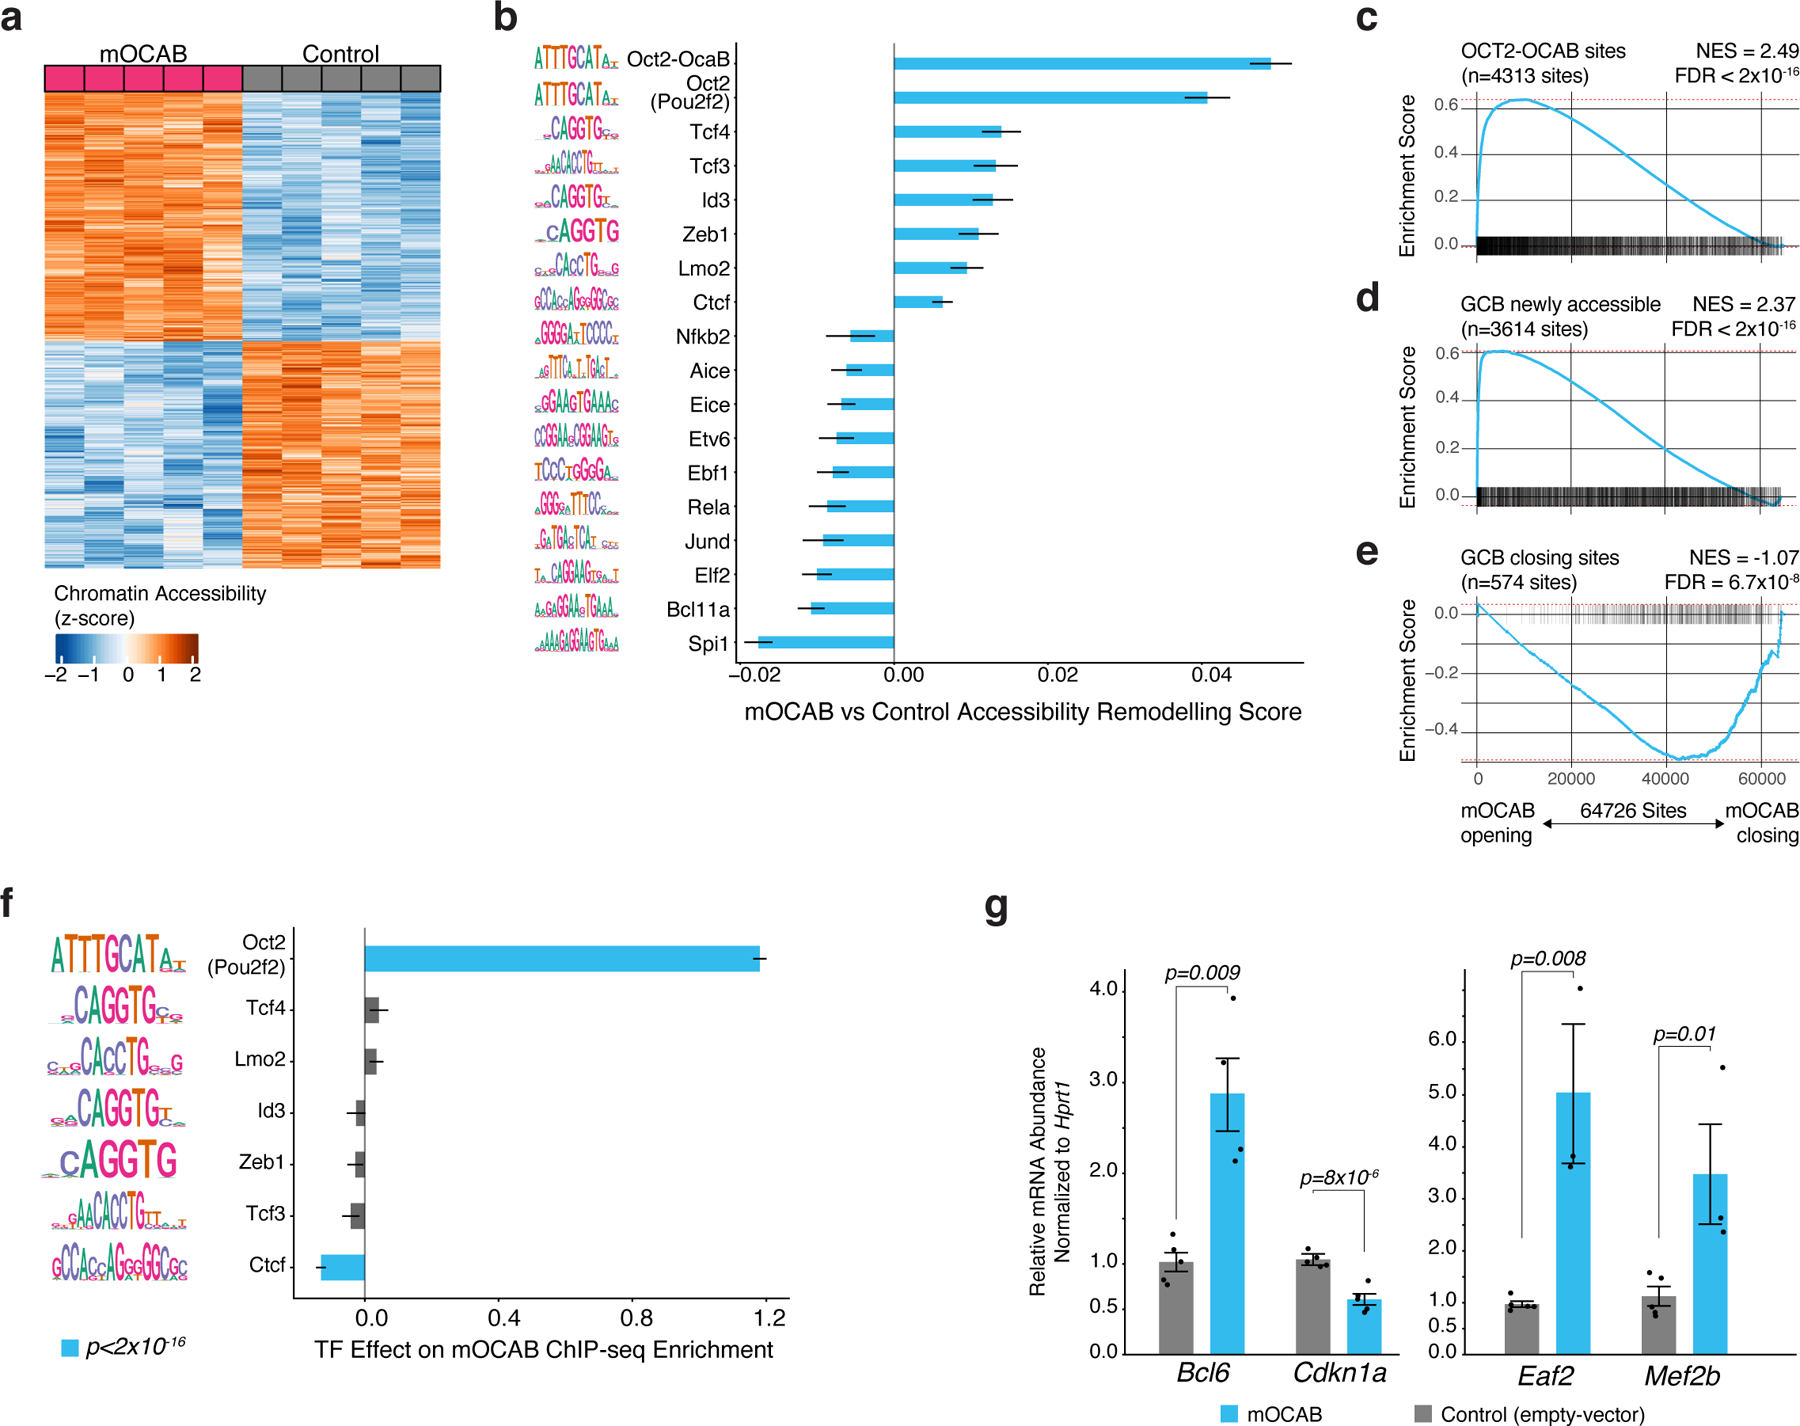
Figure 5. OCAB expression is sufficient to drive GC-specific chromatin accessibility and gene expression in murine splenic B cells.

a, heatmap of chromatin accessibility in control and mOCAB-expressing mouse splenic B cells for 784 sites and 741 sites with increased and decreased accessibility (respectively) in mOCAB relative to control. Splenic B cells from n=5 mice were stimulated with LPS ex vivo and transduced with a GFP vector containing Pou2af1 (mOCAB) or GFP only (control). b, TF accessibility remodeling in mOCAB (n=5) relative to control (n=5) murine splenic B cells for DNA mapped across 64,726 accessible sites. TF motifs with FDR<0.001 are shown. Error bars represent 95% CI of the mean. c, results of Peak-set Enrichment Analysis testing enrichment of OCT2-OCAB, GCB newly accessible (d), or GCB closing (e) peak-sets across 64,726 DNA elements in mouse B cells ranked by accessibility log2 fold-change in mOCAB (n=5) vs control (n=5). OCT2-OCAB sites defined as DNA elements that contain a mouse GCB OCAB ChIP-seq26 peak with an OCT2 motif. Differentially accessible sites were determined using mouse NB and GCB ATAC-seq data16 (Extended Data Fig 3d). Enrichment statistics were computed by GSEA43 applied to peaks (see Methods). f, bar plot showing effect estimates for TF motifs on GCB OCAB ChIP-seq enrichment across DNA elements (n=64,726) in mouse B cells. g, bar plot showing mRNA abundance relative to Hprt for Bcl6, Cdkn1a, Eaf2, and Mef2b in mOCAB (n=5) and control (n=5) GFP+ viable mouse B cells. P values are calculated by Welch t-test and error bars show standard error of the mean (SEM).
