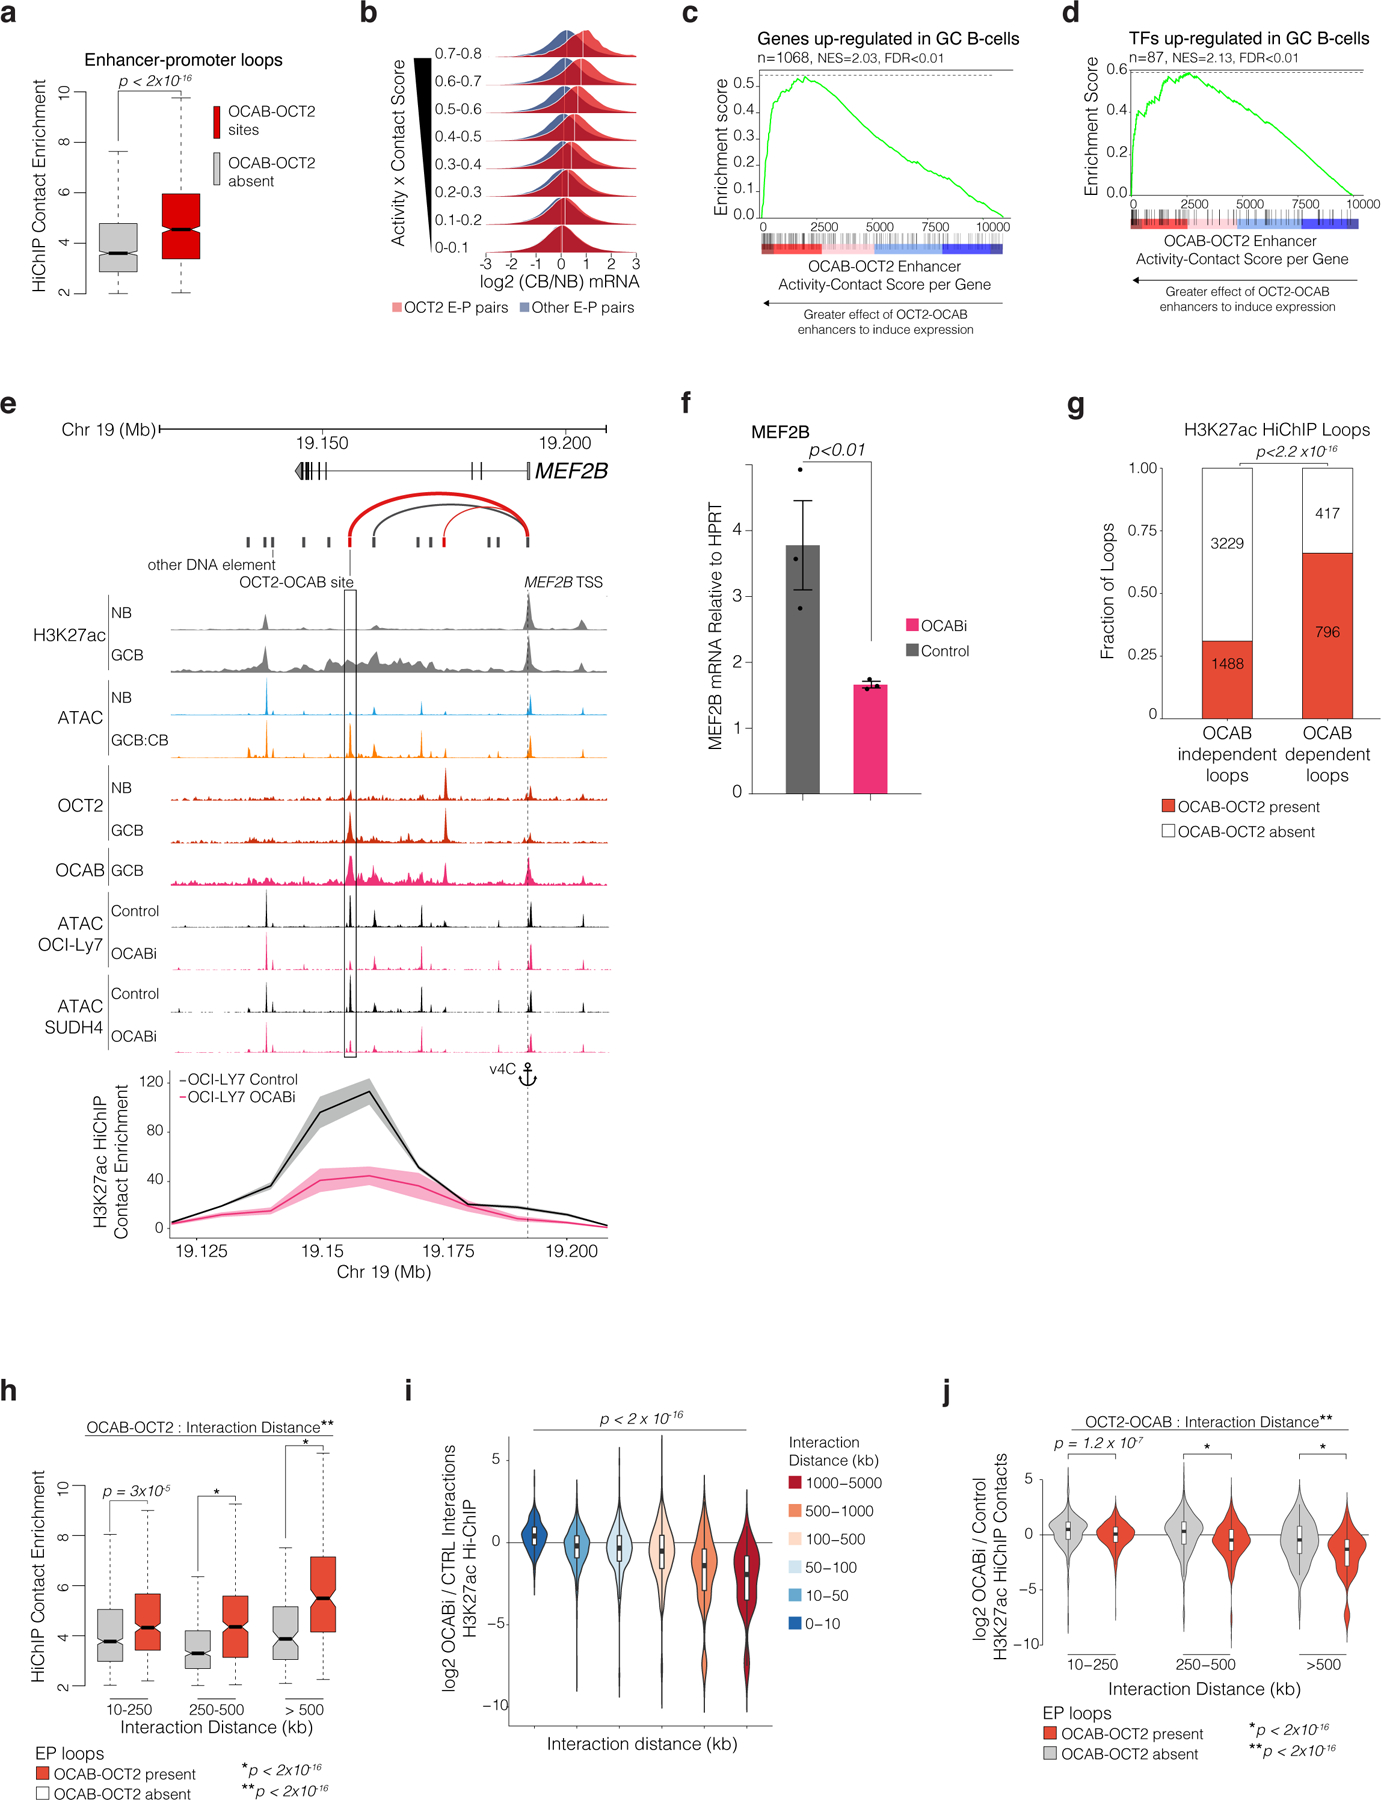
Figure 6. OCAB is required for GC-specific enhancers to interact with promoters of GC upregulated genes via intermediate and long-range looping.

a, boxplot comparing H3K27ac HiChIP contact enrichment in OCI-Ly7 cells (n=3) for EP-loops with/without OCT2-OCAB. P values calculated by Mann-Whitney U-test. b, density plots of posterior predictive distributions of gene expression log2 fold-change in GCBs vs NBs by aggregate enhancer activity-contact score for enhancers with/without OCT2-OCAB. White lines indicate mean log2 fold-change. c-d, GSEA using genes ranked by aggregate per-gene enhancer activity-contact score, with/without OCT2-OCAB and showing enrichment for genes/TFs up-regulated in GCBs (FDR<0.01, log2 FC>1.5). e, UCSC genome browser tracks showing ATAC-seq elements with (red) and without (black) OCT2-OCAB. Arcs represent enhancer-gene pairs; line weight indicates activity-contact score; Lower panel: virtual 4C plot showing H3K27ac HiChIP contact enrichment between the MEF2B promoter (anchor) and surrounding 10kb regions for OCABi (n=2) and Control (n=3) OCI-LY7 cells. Shaded area represents 95% CIs. f, Bar plot showing mean MEF2B expression versus HPRT by qPCR in OCABi (n=3) and Control (n=3) OCI-LY7 cells from 3 independent experiments. P values calculated using student’s t-test. g, bar plot showing fraction of OCT2-OCAB-anchored loops among loops with unchanged (OCAB-independent) or significantly decreased (OCAB-dependent) H3K27ac contact enrichment in OCABi (n=2) versus Control OCI-Ly7 (n=3) cells. P value calculated by Fisher’s exact test. h, box plots comparing HiChIP contact enrichment for loops with (n=1,717) or without (n=4,222) OCT2-OCAB anchor, by interaction distance. *P value by type III ANOVA F-test, **P value for OCT2-OCAB/distance interaction by likelihood ratio test. i, violin and box plots comparing log2 fold-change in H3K27ac HiChIP contact enrichment between OCABi and Control OCI-Ly7 cells at increasing distances between loop anchors. P value by Spearman rank correlation test. j, violin plots showing H3K27ac HiChIP log2 fold-changes in OCABi versus Control for loops with indicated distance between anchor mid-points, with/without OCT2-OCAB. *P value by ANOVA F-test **P value for OCT2-OCAB/distance statistical interaction by likelihood ratio test. Violin plots include minimum/maximum values. Box plots show center line as median, box limits as upper/lower quartiles, whiskers as minimum/maximum values within 1.5x inter-quartile range of 1st and 3rd quartile, and notches as approximate 95% CIs.
