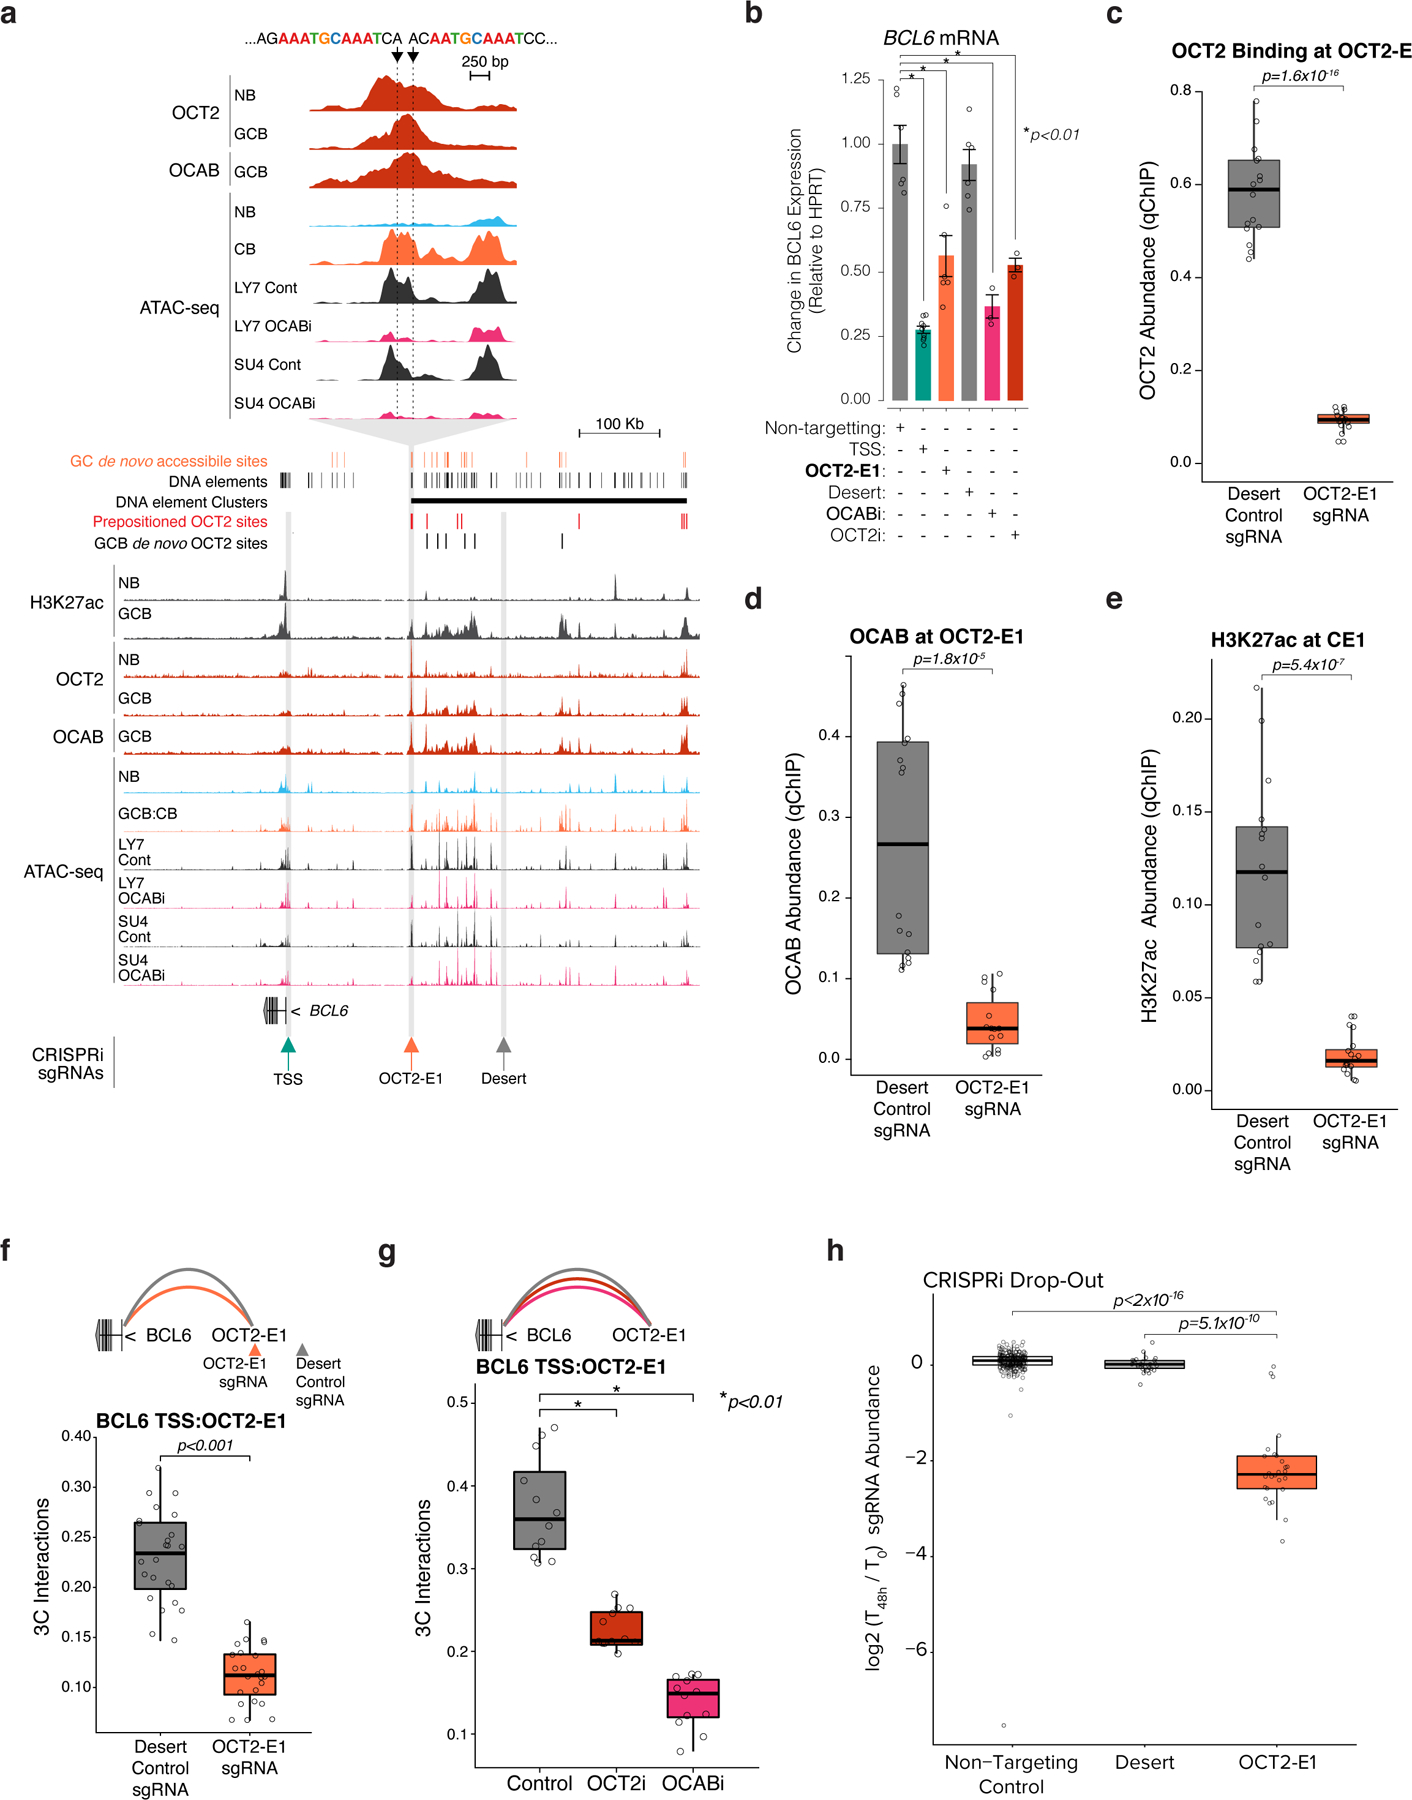
Figure 8. Binding of an OCT2-OCAB complex to the prominent OCT2 pre-positioning site within the BCL6 super enhancer is required for enhancer looping and transcriptional upregulation of BCL6.

a, genome browser tracks showing GC newly accessible sites, all DNA elements identified in B cells, DNA element clusters, pre-positioned OCT2 sites, and GCB de novo OCT2 sites (top); H3k27ac, OCT2, and OCAB ChIP-seq and ATAC-seq. Arrows at BCL6 TSS (TSS), a predominant OCT2 pre-positioned site (OCT2-E1, inset), and a silent region (desert). b, BCL6 expression in GFP+ viable OCI-Ly7 CRISPRi cells transduced with control sgRNAs or sgRNAs targeting TSS, OCT2-E1, desert, OCAB TSS (OCABi), or OCT2 TSS (OCT2i). Expression levels from GFP+ viable cells from at least 3 independent experiments were measured by qPCR. Bar plot shows fold change relative to mean of control cells and data points show independent experiments. *indicates moderated t-test p<0.01. Error bars show SEM. c, box plots of OCT2, OCAB (d), and H3K27ac (e) abundance at OCT2-E1 by qChIP in OCI-Ly7 CRISPRi cells (n=4 independent experiments) with sgRNAs targeting desert or OCT2-E1 (n=4 sgRNAs). Box plots show center line as median, box limits as upper/lower quartiles, whiskers as minimum/maximum values within 1.5x inter-quartile range of 1st and 3rd quartile, and notches as approximate 95% CIs. P values are calculated by Mann-Whitney U test. f-g, box plots showing 3C contacts between OCT2-E1 and TSS for OCI-Ly7 CRISPRi cells after transduction with sgRNAs targeting desert, OCT2-E1, (n=4 sgRNAs), non-targeting control, OCABi, or OCT2i (n=3 sgRNAs). P values are calculated by Mann-Whitney U test. h, Box plots showing results of a CRISPRi drop-out screen45 for non-targeting control sgRNAs or sgRNAs targeting desert or OCT2-E1. sgRNAs were counted and the moderated log2 fold change was computed for each sgRNA using DESeq2. P values are calculated by Mann-Whitney U test.
