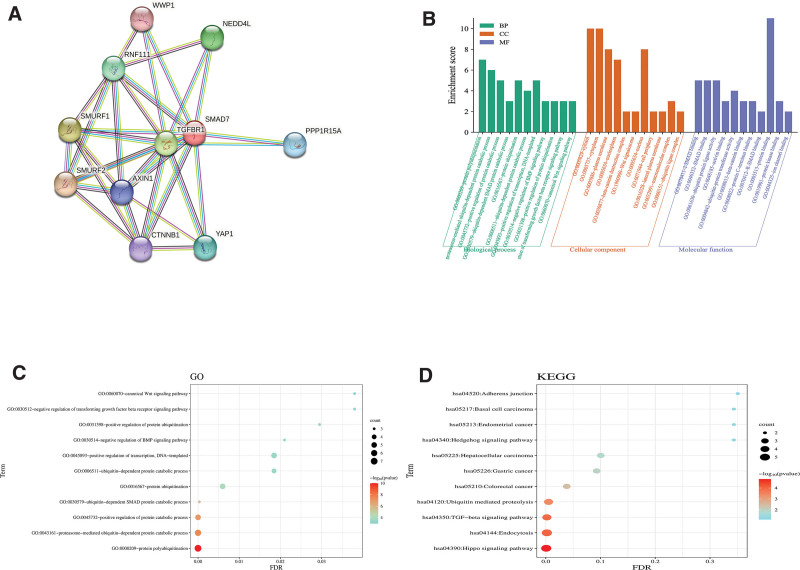
Figure 6.
Gene relationship network diagram and enrichment analysis results of SMAD7. (A) Gene relationship network diagram of SMAD7. (B) Enrichment of SMAD7-related genes in each gene ontology (GO) term and gene counts. (C) The findings of gene ontology analysis. (D) The findings of Kyoto encyclopedia of genes and genomes analysis. FDR = false discovery rate, GO = gene ontology, KEGG = Kyoto encyclopedia of genes and genomes, SMAD7 = Sma-and mad-related protein 7.

