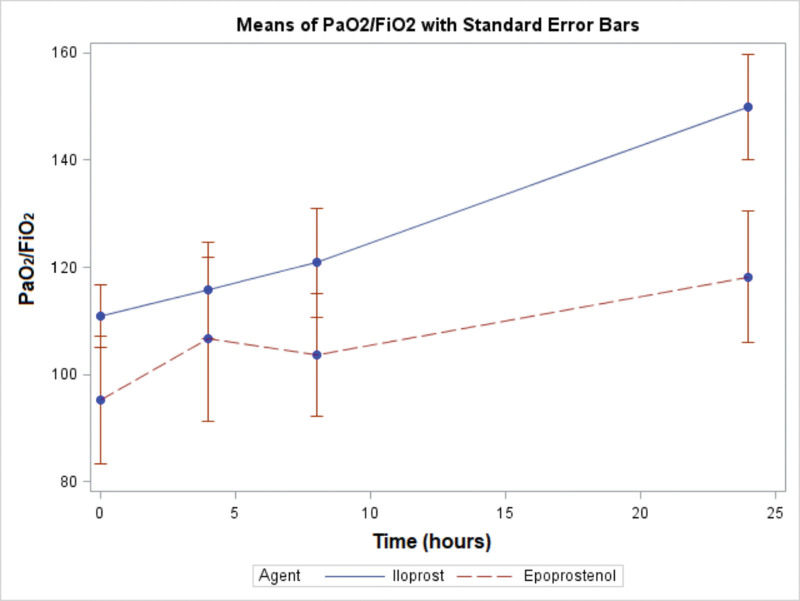
Figure 2.
Changes in oxygenation between study groups. The figure shows changes in Pao2/Fio2 over time. The bars indicate the se. Both agents were associated with improvements in Pao2/Fio2 from baseline, and the magnitude of improvement did not differ between groups. Pao2/Fio2 was numerically higher at each time point in the iloprost group, although the difference was not statistically significant.

