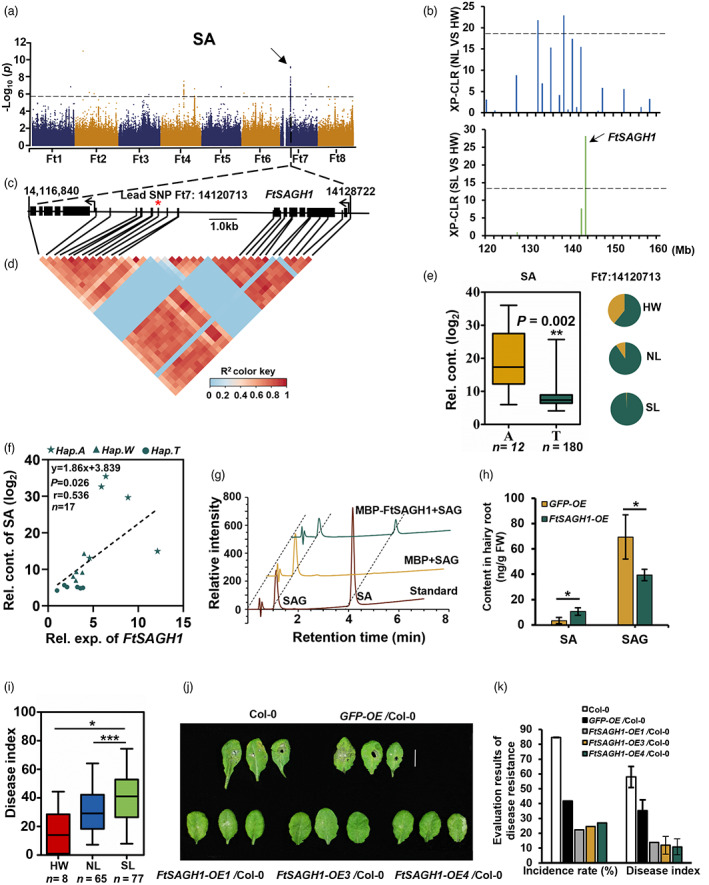
Figure 3.

Decrease of SA induces disease resistance changed during Tartary buckwheat domestication. (a) Manhattan plot and QQ plot display the GWAS results of salicylic acid (SA) content. Metabolite content was genetically associated with the sweep harbouring FtSAGH1. The dashed line indicates the threshold −log10 P = 5.68. (b) The cross population composite likelihood ratio (XP‐CLR) between NL and HW (upper), and between SL and HW (lower) on chromosome 7. The black dashed horizontal lines indicate top 10% threshold for entire chromosome 7 (threshod with 18 in NL/HW and 14 in SL/HW). The red arrows indicate the position of FtSAGH1 in the sweeps. (c) Gene model of FtSAGH1 and neighbouring gene FtPinG0707406600.01. Filled black boxes represent coding sequence. The black vertical lines mark the polymorphic sites identified by high‐throughput sequencing, and the star (*) represents the lead SNP Ft7: 14120713, located in the 3180 bp downstream FtSAGH1. (d) A representation of pairwise r 2 value (a measure of LD) among all polymorphic sites in approximately 11.9 kb region around the lead SNP. The colour gradation of each box corresponds to the r 2 value according to the legend. (e) Frequencies of the high/low‐level trait‐related allele in three groups. Box plot indicates the relative contents of SA, plotted as a function of genotypes at SNP Ft7: 14120713. The SA contents were log2 transformed, nHap.A = 12, nHap.T = 180. (f) Correlation between the relative contents of SA and the transcription level of FtSAGH1 in 17 buckwheat varieties, including 5 A‐hap, 6 W(A/T)‐hap and 6 T‐hap. P value was calculated using Student's t‐test. (g) FtSAGH1 enzymatic assay in vitro. The different reaction curves by LC–MS were showed. Protein extract from E. coli containing the pMAL‐C5X empty vector was used as a negative control. (h) SA and SAG (salicylic acid‐2‐O‐β‐glucoside) content in FtSAGH1 overexpression hairy roots mixed from three independent lines and five independent experiments were performed. The hairy roots GFP ‐ OE (infected by A4 containing 35S: GFP) were used as negative control. (i) Box plot of disease index infected by Rhizoctionia solani in different variations among HW, NL and SL groups. nHW = 8, nNL = 65, nSL = 77. (j) Phenotype of disease resistance to Rhizoctonia solani in ectopic expression of FtSAGH1 in Arabidopsis. (k) Evaluation of disease resistance to Rhizoctonia solani in (j). Three biological replicates were performed each lines except FtSAGH1‐OE3/Col‐0. Data in (e), (f), (h), (i) and (k) are presented as mean ± SD. Significant differences are indicated by asterisks: *, P < 0.05; **, P < 0.01; ***, P < 0.001, Student's t‐test.
