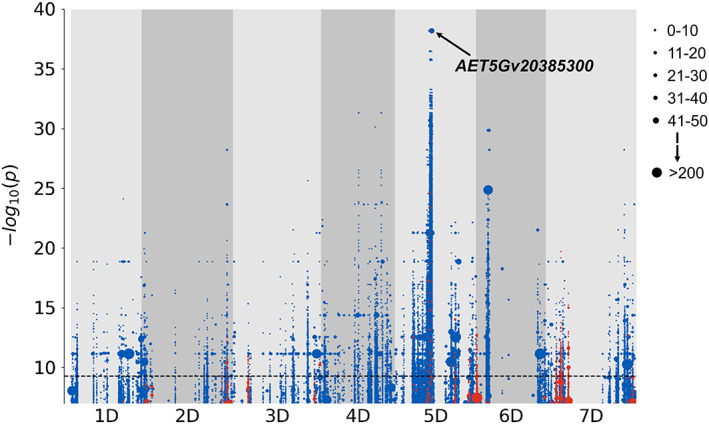
Figure 3.

k‐mer‐based association genetics for deoxynivalenol (DON) severity. Points on the plot illustrate k‐mers associated with DON resistance (blue) or DON susceptibility (red) mapped to the Aegilops tauschii reference genome AL8/78 partitioned to chromosomes 1D to 7D. On chromosome 5D, the k‐mer comprising the uridine diphosphate (UDP)‐glucosyltransferase (UGT) AET5Gv20385300 is highlighted. −log10 P‐value = 9.3 was taken as the Bonferroni‐adjusted threshold for evaluating the statistical significance of an association. Point size is proportional to the number of k‐mers with a specific −log10 P‐value (see insert).
