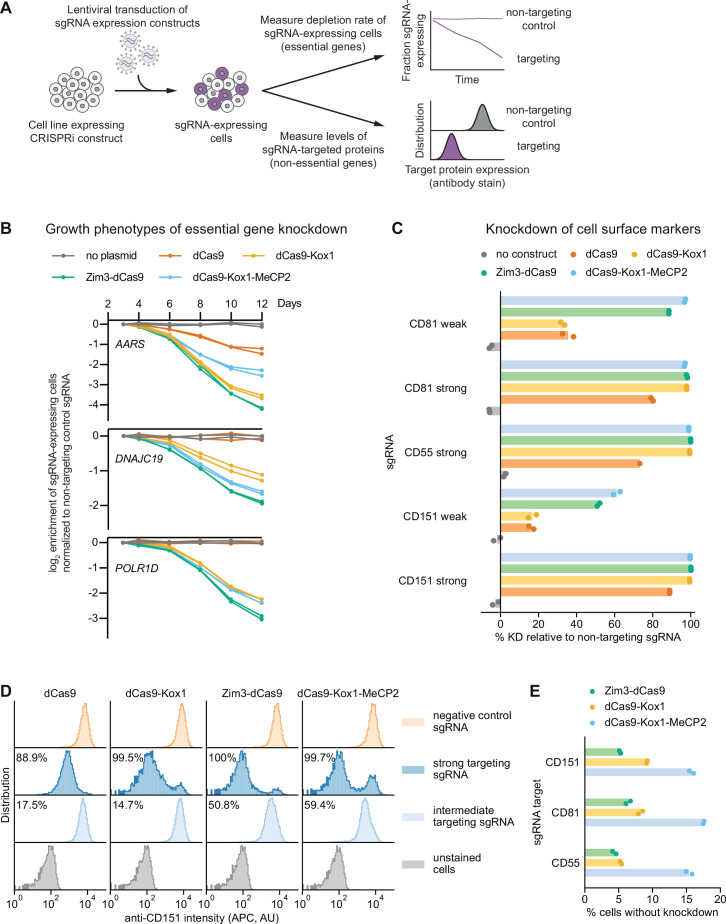
Figure 3. Zim3-dCas9 and dCas9-Kox1-MeCP2 mediate strongest knockdown.
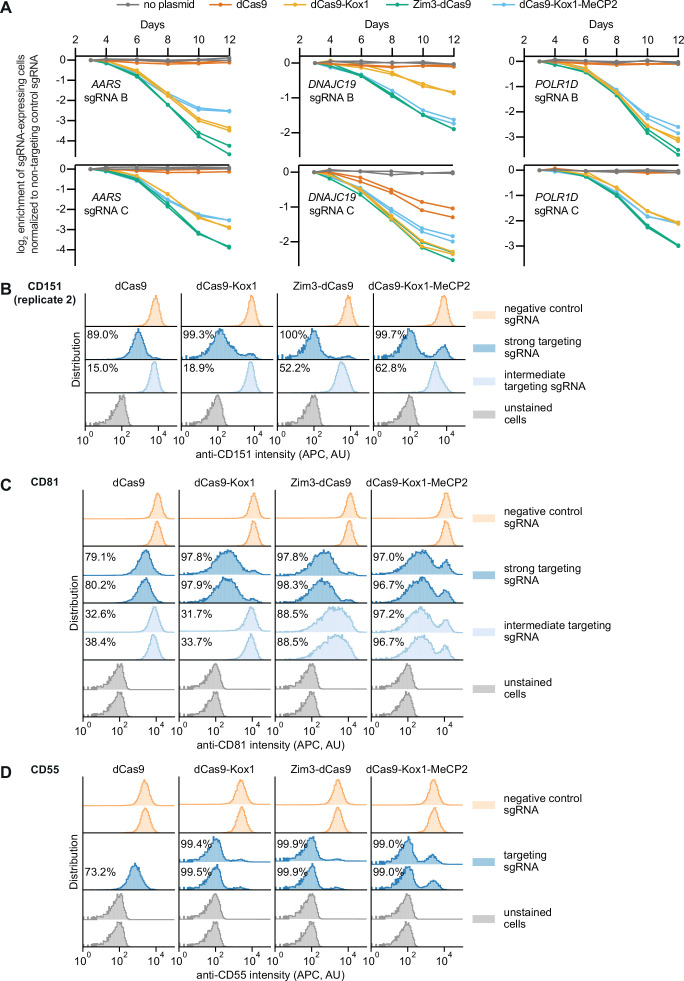
(A) Experimental design to measure knockdown mediated by different CRISPR interference (CRISPRi) effectors by delivering single guide RNAs (sgRNAs) targeting either essential genes or cell surface markers. (B) Depletion of K562 cells expressing essential gene-targeting sgRNAs and different CRISPRi effectors, measured as the ratio of mCherry-positive (sgRNA-expressing) to mCherry-negative (not sgRNA-expressing) cells in a given well. mCherry levels were measured for 12 days after transduction, starting on day 3. Data from two replicate transductions. (C) Percent knockdown of cell surface markers by different CRISPRi effectors in K562 cells. Cell surface marker levels were measured on day 6 post-transduction by staining with an APC-conjugated antibody. Knockdown was calculated as the ratio of median APC signal in sgRNA-expressing cells and median APC signal in cells expressing a non-targeting control sgRNA after subtraction of background APC signal. Data from two replicate transductions. Cells expressing dCas9 and a strong CD55-targeting sgRNA are represented by a single replicate. (D) Distribution of anti-CD151 signal intensity (APC) in individual cells from one representative transduction. Data from second replicate are shown in Figure 3—figure supplement 1B. Knockdown was quantified as in C as the ratio of the median APC signals. (E) Percentage of cells without observable knockdown despite expressing a strong sgRNA, as quantified from the fluorescence distributions.


