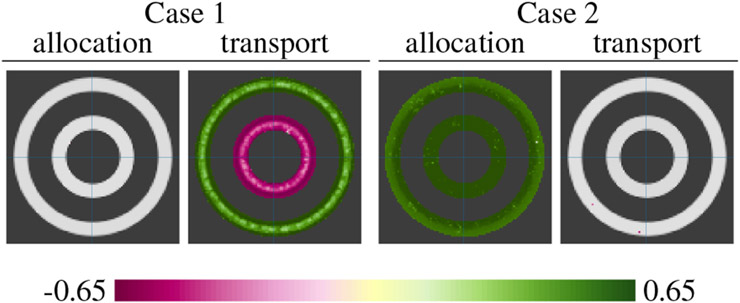
Fig. 3.
Correlation to allocation and transport features in two cases on a toy example. In Case 1, each sample image has the same overall mass, but the mass is differently distributed among the two annuli. Color shows correlation between the total mass of the outer annulus and the OTF (mass allocation and transport cost) at each pixel. We see that OTF correctly identified that the effect is due to a trade-off in mass between the inner and outer annuli, and not due to random variation of total mass. There is a statistically significant correlation to transport, but not to allocation. In Case 2, each sample image has a random overall mass which is randomly distributed between the two annuli. Color shows correlation between the total mass of both annuli and the OTF at each pixel. We see that OTF correctly identified the overall difference in mass.

