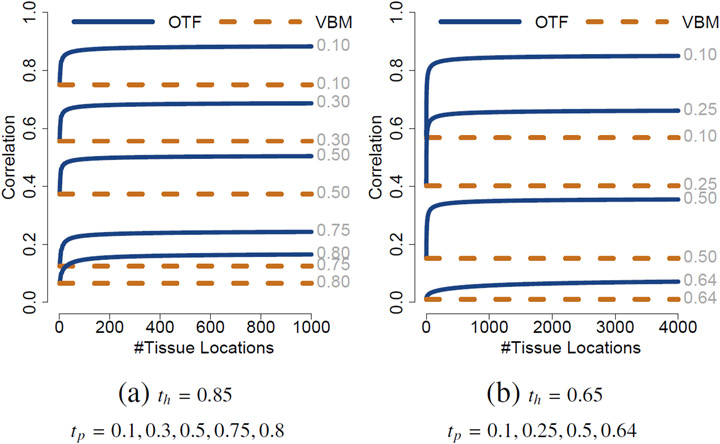
Fig. 4.
Plots of the correlation strength for the analysis described in the text. Correlation as a function of the number of tissue locations with (a) th = 0.85 and (b) th = 0.65 and varying tp for p = 0.5. The OTF extraction step improves correlation for dispersed tissue loss: An increasing number of locations with tissue loss increases the correlation strength when using OTF.

