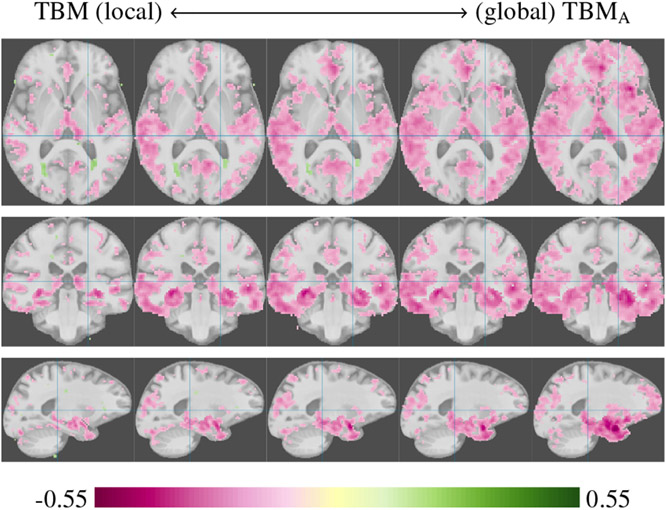
Fig. 8.
Inverse correlations of gray matter to CDR, illustrating the continuum from TBM analysis to TBMA with global mass balancing. From left to right the cost of allocating mass is increased, causing a more global mass balancing to be enforced. The global TBMA analysis can mask local effects if there is no overall difference in tissue loss between the populations. Performing the analysis at different spatial scales improves the odds of discovering local and global effects.

