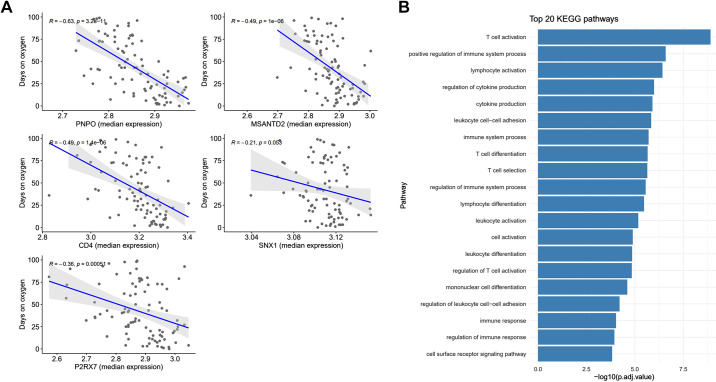
Figure 5.
A: correlation plot with 95% confidence interval of the median expression of the 5-gene signature (x axis), on day of life 5, by the cumulative number of days the neonate received oxygen while in the intensive care unit (y axis). Gray dots illustrate gene expression for each neonate. R = correlation coefficient. B: top 20 Kyoto encyclopedia of genes and genomes (KEGG) pathways dysregulated in neonates with bronchopulmonary dysplasia (BPD) compared with no BPD on day of life 5. Genes with a false discovery rate <0.01 (n = 4,000) between the groups were used to organize pathways. CD4, CD4 molecule; MSANTD2, Myb/SANT DNA binding domain containing 2; P2RX7, purinergic receptor P2X, ligand-gated ion channel 7; PNPO, pyridoxine 5′-phosphate oxidase; SNX1, sorting nexin 1.

