
Figure 5.
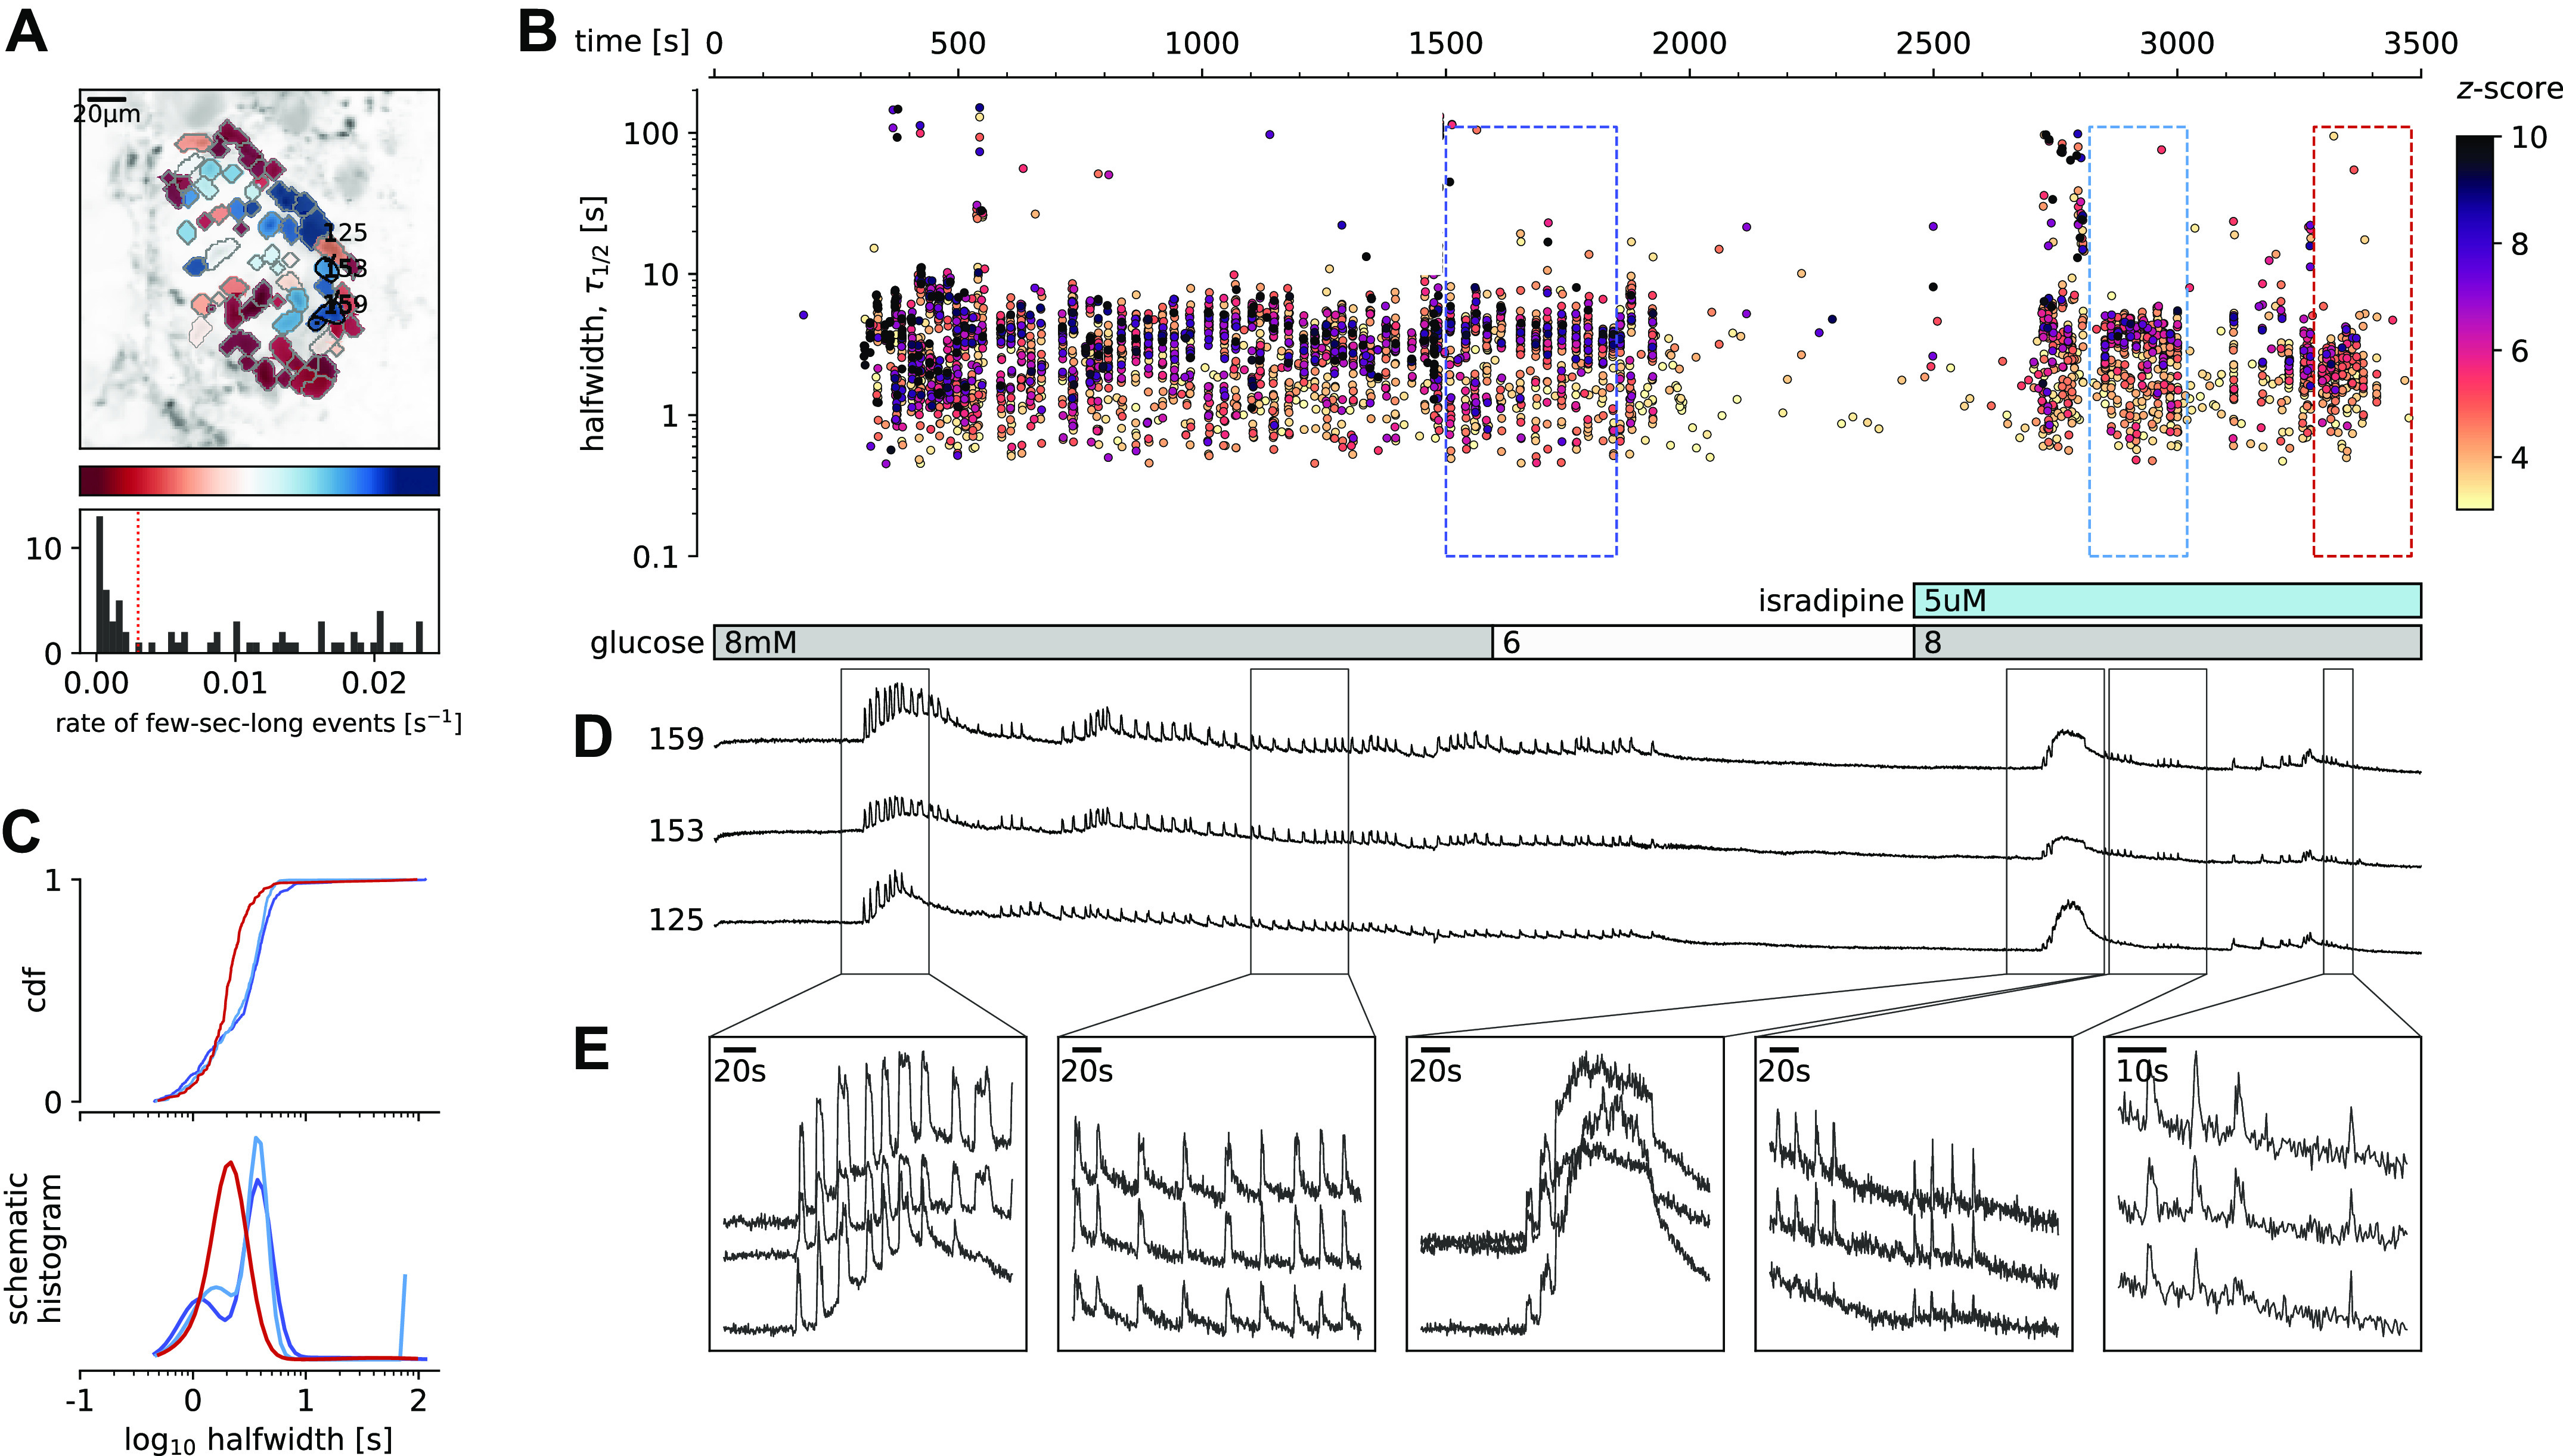
Glucose-dependent activation of β cells in the presence of inhibitory isradipine concentration to block voltage-activated Ca2+ channels (VACCs). A: regions of interest (ROIs) obtained by our segmentation algorithm. The color indicates the number of events identified in the ROI trace, upon a high-pass filtering at 0.2 Hz. We discarded ROIs with number of events below the threshold (red dashed line in the histogram in the bottom). Indicated are the ROI numbers whose filtered traces correlate best with the average trace for the whole islet. B: events’ halfwidth duration through time for an islet exposed to a double 8 mM glucose stimulation protocol. Saturating concentration of VACC blocker isradipine (5 µM) was applied in the second section of the protocol. The stimulation protocol is indicated in the bar at the bottom of the pane. There is a prominent superposition of the short events on the plateau phases between the ROIs. C, top: cumulative distribution frequency (CDF) of a mean halfwidth duration of events during the plateau phase of the both stimulations. Bottom: normalized Gaussian fit through the logarithmic distribution of halfwidth duration during control conditions and inhibition of VACCs. Note a shift toward shorter events during the late plateau phase in the presence of isradipine. D: time courses from ROIs indicated in A, exposed to a double stimulation protocol, and rebinned to 2 Hz (original frequency is 20 Hz). The abscissa is shared with B and is indicated there. E: expanded time traces from a representative ROI indicating (as indicated in C) the a long event from the initial transient phase, followed by a plateau phase in control, long event during initiation of the second stimulation, short events from early plateau phase, and further shortened events from a late plateau phase.