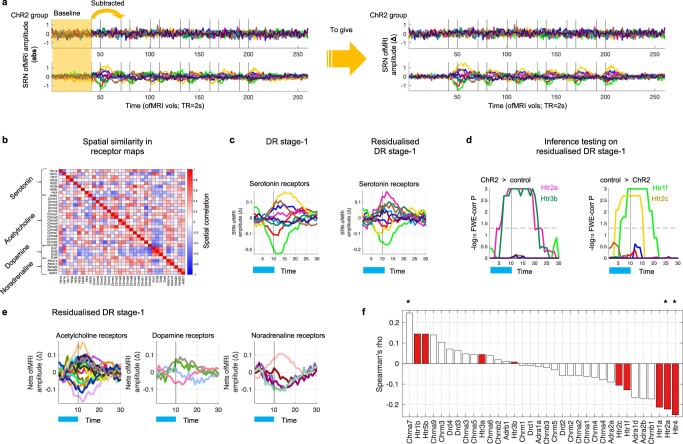
Extended Data Fig. 2. SRNs fluctuations during DRN ofMRI and specificity.
Related to Fig. 2. a) Left: Showing SRN fluctuations in absolute (abs) amplitude in response to DRN ofMRI. Yellow area indicates the average SRN absolute (abs) amplitude activity (DR-stage 1 SRN amplitude fluctuations) during the first 40 timepoints. This average activity was subtracted from the remaining timepoints in order to take into account baseline. Right: Showing SRN delta (Δ) amplitude obtained from the process depicted in the left. b) Spatial similarity between all receptor maps: serotonin, acetylcholine, dopamine, and noradrenaline, demonstrating that there is low to modest correlation between most spatial maps as expected, as different receptor maps have distinct though overlapping spatial distributions. Spatial similarity was calculated at the voxel-wise whole-brain level. c) Time-locked ofMRI amplitude changes in SRNs calculated in ChR2 animals (left) via DR stage-1 (as also shown in main figures) and (right) via residualised DR stage-1. Blue bar underneath represents when optogenetic stimulation was on. d) Results from permutation analysis of linear models on residualised DR stage-1 SRN time-locked responses between control and ChR2 animals. Statistical significance was assessed with 1,000 block-aware permutations with FWE-corr for multiple comparisons. Showing -log10 FWE-corr p-values, corrected across time, SRNs, and two tails. Dashed lines demarcate statistical thresholds. e) Time-locked ofMRI amplitude changes in other receptor networks (Nets) calculated in ChR2 animals via residualised DR stage-1. f) Spearman’s partial correlation between multiple neuromodulatory receptor maps and DRN ofMRI activity as previously implemented by Zerbi et al. (see Methods). Two-tailed significance was assessed with permutation testing and partial correlations were deemed significant at FWE-corr P < 0.025. The * symbol above bars indicates a statistically significant FWE-corr p-value. Red bars indicate serotonin receptors. This analysis shows that serotonin receptors have the highest partial correlation values with DRN ofMRI changes.

