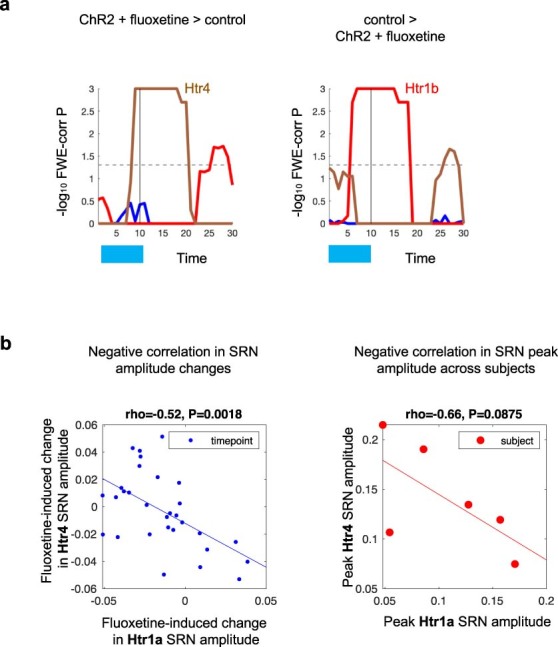
Extended Data Fig. 3. Cross-receptors relationship between Htr1a and Htr4 SRNs.

Related to Fig. 3. a) Results from permutation analysis of linear models for group differences between the ChR2 group treated with fluoxetine and the control group in SRN time-locked amplitude changes. Statistical significance was assessed with 1,000 block-aware permutations (whilst allowing permutations only within-subject), with FWE-corr for multiple comparisons. Showing -log10 FWE-corr p-values, corrected across time and two tails. Dashed lines demark statistical thresholds. b) Showing negative correlations between Htr1a and Htr4 SRN activity. Correlation assessed via one-tail Spearman’s correlation. Left: scatter plot relating fluoxetine-induced changes in Htr1a and Htr4 SRN amplitude during ofMRI experiments. Right: scatter plot relating fluoxetine-induced peak activity in Htr1a and Htr4 SRN amplitude across subjects. For both left and right scatter plots, fluoxetine-induced changes are fluoxetine + ChR2 minus ChR2 only ofMRI amplitude changes.
