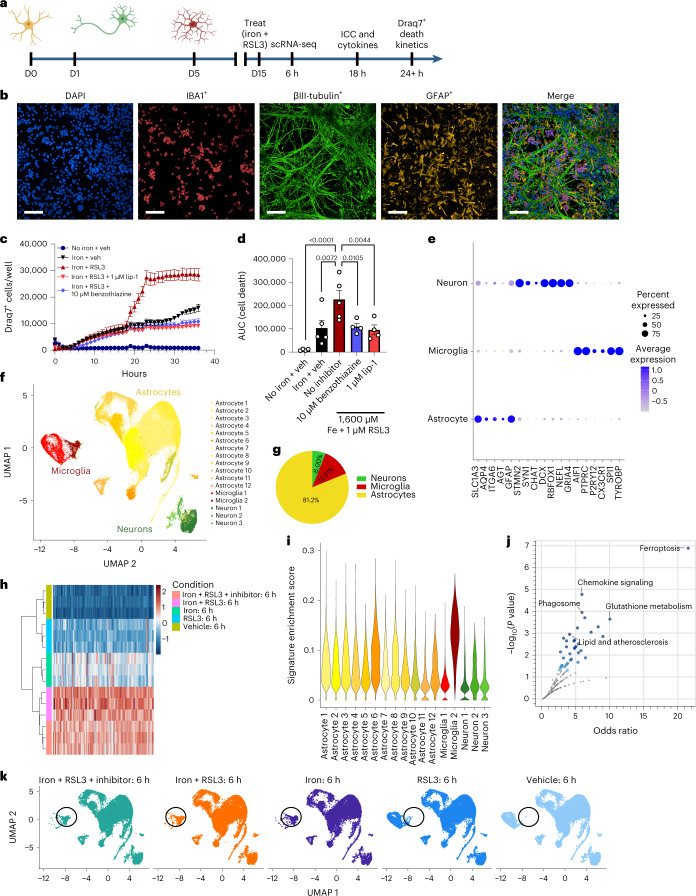
Fig. 1. Ferroptosis induction causes a unique transcriptional response and cell death in iPSC tri-cultures.
a, Schema for generation of tri-culture and downstream analysis. Illustrations were created with BioRender. b, Representative image of tri-culture showing IBA1+ (red) microglia, βIII-tubulin+ (green) neurons and GFAP+ (yellow) astrocytes. Scale bar, 100 µm (n = 3 biologically independent experiments). c, Draq7+ death kinetics in tri-cultures exposed to 1,600 µM iron + 1 µM RSL3 ± 1 µM lip-1 or 10 µM benzothiazine. Representative graph (n = 1 biologically independent experiment). Error bars represent s.e.m. of the technical replicates. d, Area under the curve (AUC) of death kinetics 12 hours after separation from iron + veh condition (n = 4 biologically independent experiments). Two-way ANOVA, Dunnett post hoc. P values are indicated in the graph. Error bars represent s.e.m. e, Dot plot of cell-type-specific genes for microglia, neurons and astrocytes. f, UMAP representation of scRNA-seq analysis of 109,100 cells from tri-cultures exposed to vehicle or 1,600 µM iron + 1 µM RSL3 ± commercial ferroptosis inhibitors. g, Pie chart for percentages of each cell type in scRNA-seq collection. h, Pseudo-bulk analysis of all cell types and heat map of top dysregulated genes. Inhibitor was 10 µM benzothiazine (n = 3 biologically independent experiments). i, Violin plot of iron + RSL3-induced signature enrichment UCell score for all 17 clusters using the top 50 genes from h. j, KEGG pathway analysis of top 200 DEGs in iron + RSL3-induced signature. Fisher exact test. k, UMAP colored by treatment condition. D, day; veh, vehicle.

