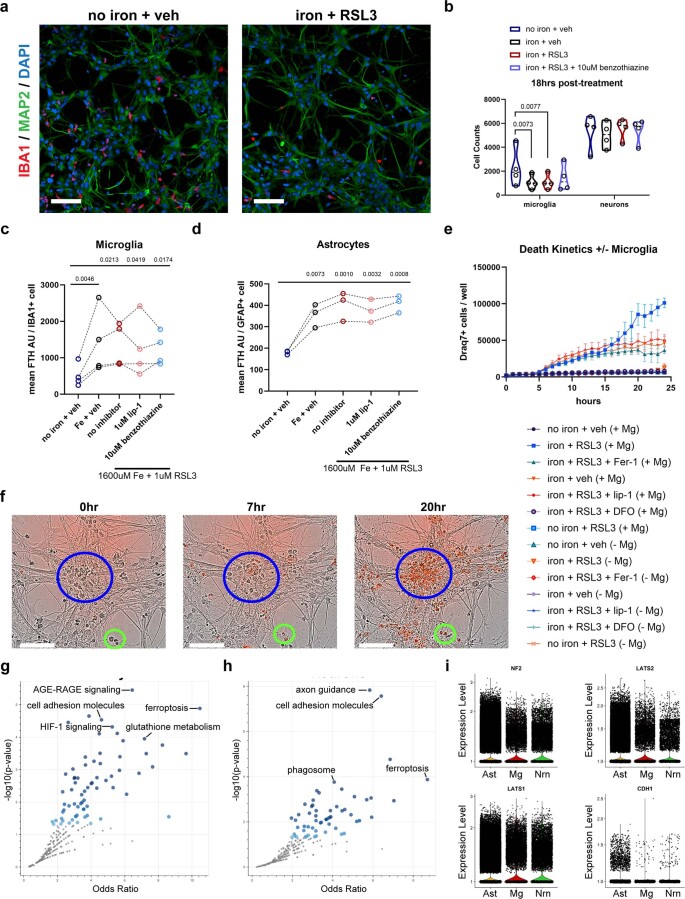
Extended Data Fig. 3. Ferroptosis is induced in microglia, followed by neurons.
a, Representative images of IBA1+ microglia (red) and MAP2+ neurons (green) in tri-culture after 18 hr exposure to no iron + veh or iron + RSL3 treatments. Scale bar = 100 µm. b, Quantification of microglia and neurons 18hrs post-treatment (n = 4 biologically independent experiments). One-way ANOVA, Dunnett post hoc, log transformed. p-values are indicated in graph. c, Quantification of ferritin expression in microglia (n = 4 biologically independent experiments). Log transformed, RM one-way ANOVA, Dunnett post hoc. p-values are indicated in graph. d, Quantification of ferritin expression in astrocytes (n = 3 biologically independent experiments). One-way ANOVA, Dunnett post hoc. p-values are indicated in graph. e, Full death kinetics for all conditions of tri-cultures with and without microglia (n = 3 biologically independent experiments). Error bars represent SEM. f, Representative images of tri-culture treated with iron + RSL3 at 0 hr, 7hrs, and 20hrs post-treatment (n = 4 biologically independent experiments). Blue circle identifies a neuron cluster. Green circle identifies microglia by morphology. Red cells are Draq7+ cells, indicating microglia death by 7hrs and neuronal death around 20hrs post-treatment. Scale bar = 100 µm. g, KEGG pathway analysis of top 200 upregulated and downregulated genes in astrocytes in iron + RSL3 versus veh. Fisher exact test. h, KEGG pathway analysis of top 200 upregulated and downregulated genes in neurons in iron + RSL3 versus veh. Fisher exact test. i, violin plots for NF2, LATS1, LATS2, and CHD1 in astrocytes (Ast), microglia (Mg), and neurons (Nrn).

