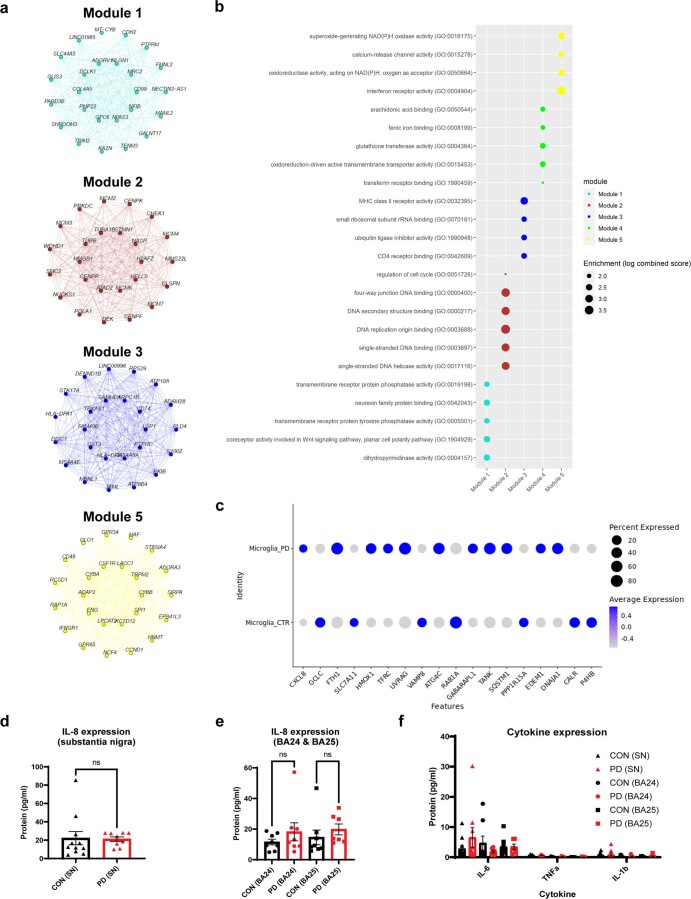
Extended Data Fig. 5. Tri-culture modules, pathway analysis, and IL-8 levels in control and Parkinson’s disease brain homogenates.
a, Gene networks for modules 1,2,3, and 5. b, Select enriched pathways for tri-culture modules. c, Dotplot of expression for genes enriched in FAS microglia. d, IL-8 protein measured in human substantia nigra (SN) tissue by MSD (V-PLEX Proinflammatory Panel 1 Human Kit- K15049D). IL-8 protein was measured in control (CON) and Parkinson’s disease (PD) substantia nigra. (n = 10 con, n = 8 PD biologically independent samples). Two-tailed, unpaired t test. ns = non-significant. Error bars represent SEM. e, IL-8 protein measured in Brodmann’s Area 24 and 25 (BA24 & BA25). (n = 8 biologically independent samples). Two-way ANOVA, Sidak post hoc. ns = non-significant Error bars represent SEM. f, Expression of key cytokines including IL-6, TNFα, and IL-1β measured by MSD (V-PLEX Proinflammatory Panel 1 Human Kit- K15049D). Same samples measured as in (a) and (b) including SN, BA24 and BA25. No differences observed between CON and PD. Two-way ANOVA, Sidak post hoc. Error bars represent SEM.

