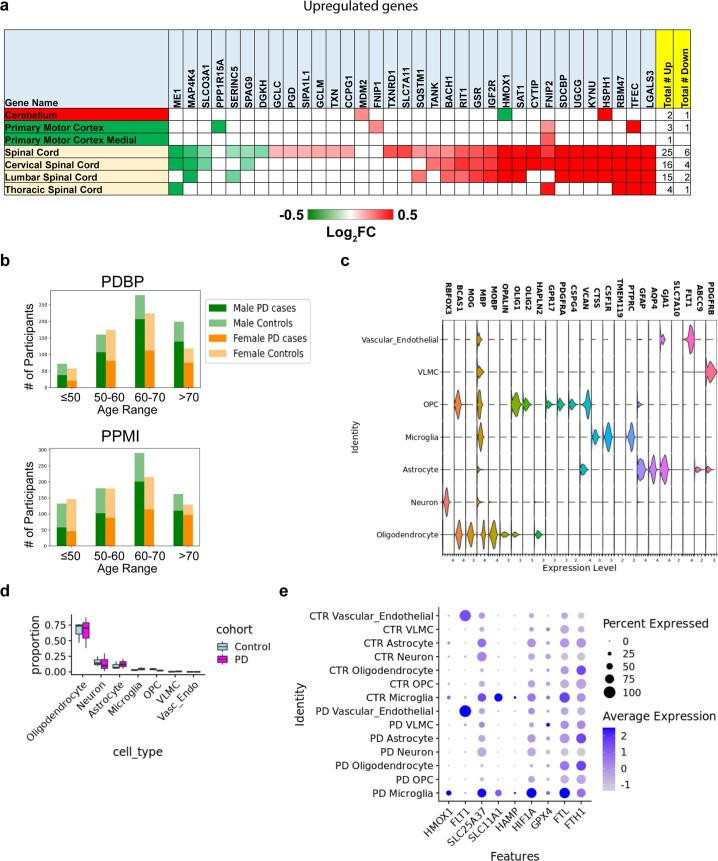
Extended Data Fig. 6. Ferroptosis-related gene expression in ALS patient spinal cord, information on AMP-PD cohorts, and cell type identification in PD single nucSeq and expression analysis of MS microglia iron-related signature in each cell type.
a, Heatmap of upregulated genes in tri-culture ferroptotic microglia in ALS patients compared to control. Boxes shown in red or green are genes with Padj < 0.05. The number of samples, area, and disease state analyzed are reported in Table S1. Statistical analysis performed with DESeq2. b, Breakdown of case, control, age, and gender for the PPMI and PDBP studies by the AMP-PD consortia. c, Violin plots for cell-type specific gene expression for endothelial cells, microglia, astrocytes, neurons, oligodendrocytes, and OPCs. d, proportions of each cell type from control and PD tissue. Minima = minimum value, maxima = maximum value, center = median, bounds of box = 25th and 75th percentile, bounds of whisker = minima and maxima. e, MS microglia iron-related signature was upregulated specifically in PD microglia compared to control and other cell types.

