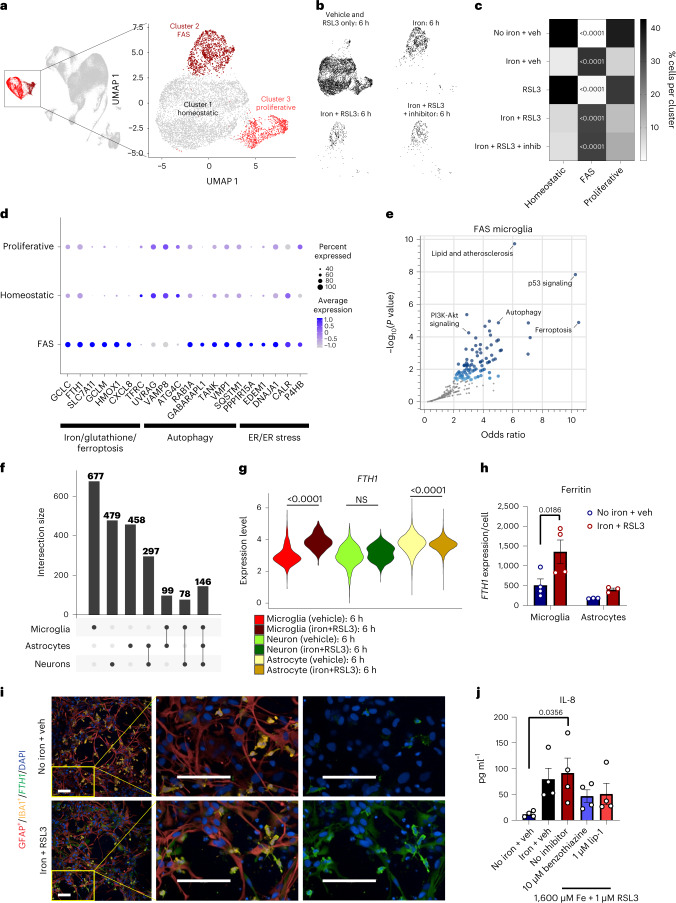
Fig. 2. Ferroptosis induction causes a profound shift in microglia cell state compared to astrocytes and neurons.
a,b, UMAP microglia subclusters (homeostatic, FAS and proliferative) (a) and plots for each treatment condition in black (b). c, Heat map of the normalized percent of cells from each sample assigned to each cluster. Two-way ANOVA, Tukey post hoc. P values are indicated in the graph. d, Select dysregulated genes associated with ferroptosis, autophagy or ER stress. e, KEGG pathway analysis of the top 200 upregulated and downregulated genes in FAS microglia cluster. Fisher exact test. f, Intersections of the top 1,000 dysregulated genes among microglia, neurons and astrocytes in iron + RSL3 versus vehicle. g, Violin plots for FTH1 expression in microglia (red), neurons (green) and astrocytes (yellow) under vehicle or iron + RSL3 conditions. Wald test with DESeq2. NS, not significant. P values are indicated in the graph. h, Average expression of FTH1 per IBA1+ microglia (n = 4 biologically independent experiments) or GFAP+ astrocyte (n = 3 biologically independent experiments). Log-transformed, two-way ANOVA, Sidak post hoc. P values are indicated in the graph. Error bars represent s.e.m. i, Representative images of FTH1 (green) expression in IBA1+ microglia (yellow) and GFAP+ astrocytes (red) in tri-cultures 18 hours after treatment. Scale bar, 100 µm (n = 3 biologically independent experiments). j, IL-8 production among conditions (n = 4 biologically independent experiments). One-Way ANOVA, Dunnett post hoc. P values are indicated in the graph. Error bars represent s.e.m. NS, not significant; veh, vehicle.

