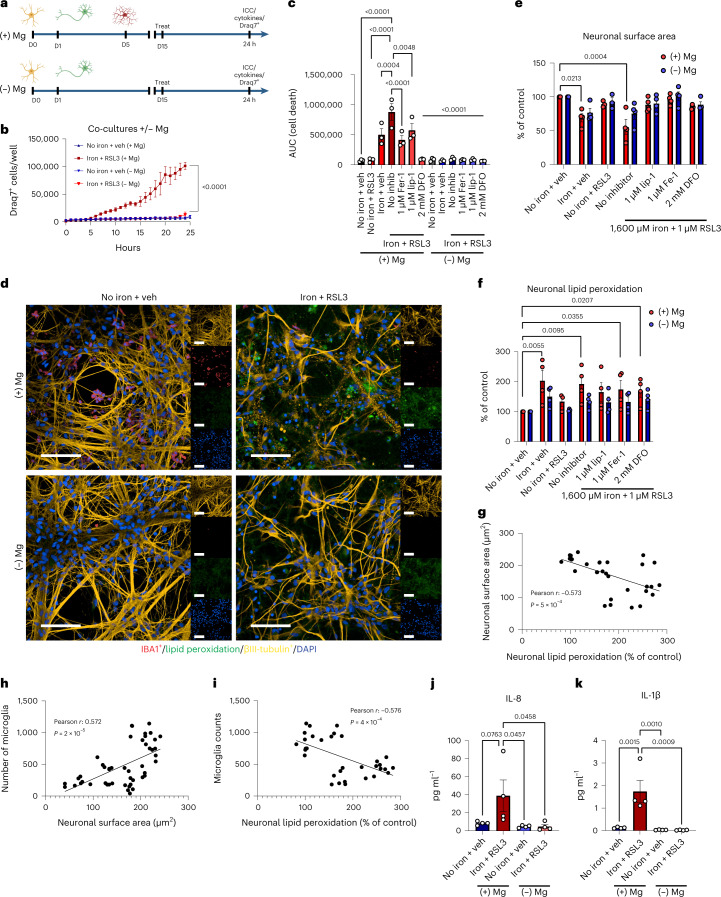
Fig. 3. Microglia sensitize neurons to ferroptosis-dependent degeneration.
a, Schema for co-cultures ± microglia. Illustrations were created with BioRender. b, Draq7+ death kinetics in tri-cultures exposed to 1,600 µM iron + 1 µM RSL3 ± microglia (n = 3 biologically independent experiments). Two-way ANOVA, Dunnett post hoc. P values are indicated in the graph. c, AUC of death kinetics (n = 3 biologically independent experiments). Two-way ANOVA, Dunnett post hoc. P values are indicated in the graph. Error bars represent s.e.m. d, Representative images of cultures ± microglia under vehicle or ferroptotic conditions. βIII-tubulin+ (yellow) neurons are dying and have increased lipid peroxidation (green) in cultures with IBA1+ (red) microglia (n = 4 biologically independent experiments). Scale bar, 100 µm. e, Average neuronal surface area in cultures ± microglia (n = 3 for no iron + RSL3; n = 4 biologically independent experiments for all other conditions). Two-way ANOVA, Sidak post hoc. P values are indicated in the graph. Error bars represent s.e.m. f, Lipid peroxidation in neurons (n = 3 for no iron + RSL3; n = 4 biologically independent experiments for all other conditions). Log-transformed, two-way ANOVA, Dunnett post hoc. P values are indicated in the graph. Error bars represent s.e.m. g, Correlation of neuronal surface area and neuronal lipid peroxidation (n = 33 wells examined over three biologically independent experiments). Two-tailed simple linear regression. h, Correlation of microglia number and neuronal surface area (n = 48 wells examined over four biologically independent experiments). Two-tailed simple linear regression. i, Correlation of microglia number and neuronal lipid peroxidation (n = 33 wells examined over three biologically independent experiments). Two-tailed simple linear regression. j,k, IL-8 (j) and IL-1β (k) production in supernatants from co-cultures ± microglia ± ferroptosis treatment (n = 4 biologically independent experiments). One-way ANOVA, Dunnett post hoc. P values are indicated in the graph. Error bars represent s.e.m. D, day.

