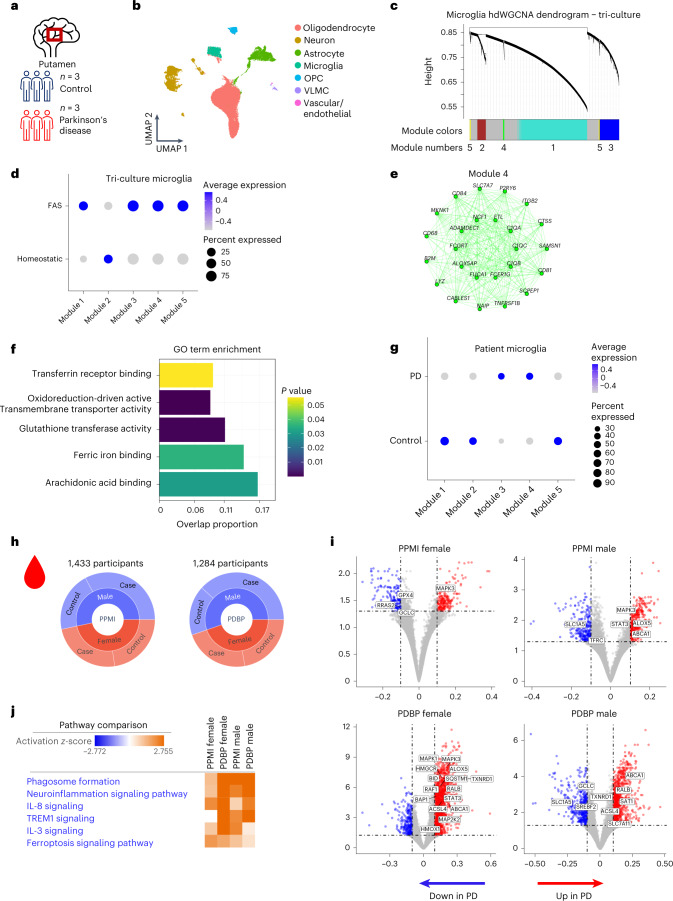
Fig. 4. Detection of FAS signature in the microglia of patients with PD and a ferroptosis gene signature in the AMP PD patient blood samples.
a, Brain region and sample size for nucSeq dataset. b, Unsupervised clustering and annotation of cell types identifies microglia cluster present in control and PD samples. c, Dendrogram identifying five hdWGCNA modules in FAS microglia. d, Dot plot for enrichment of modules in FAS and homeostatic microglia from tri-culture. e, Network plot showing top hub genes for module 4 (green). f, GO pathway analysis for module 4. Fisher exact test. g, Dot plot for enrichment of modules in PD and control microglia. h, Breakdown of participants in PPMI and PDBP cohorts by gender and disease status. i, Volcano plots for DEGs, −0.1 < log2 fold change < 0.1 and adjusted P < 0.05, between healthy controls and patients with PD stratified by gender and cohort. Wald test with DESeq2. j, IPA comparison analysis of DEGs (inclusion cutoffs: −0.1 < log2 fold change < 0.1 and adjusted P < 0.05 with male and female patients in PPMI and PDBP studies). The pathways were generated through the use of Qiagen IPA (https://digitalinsights.qiagen.com/IPA). VLMC, vascular lepotomeningeal cell.

