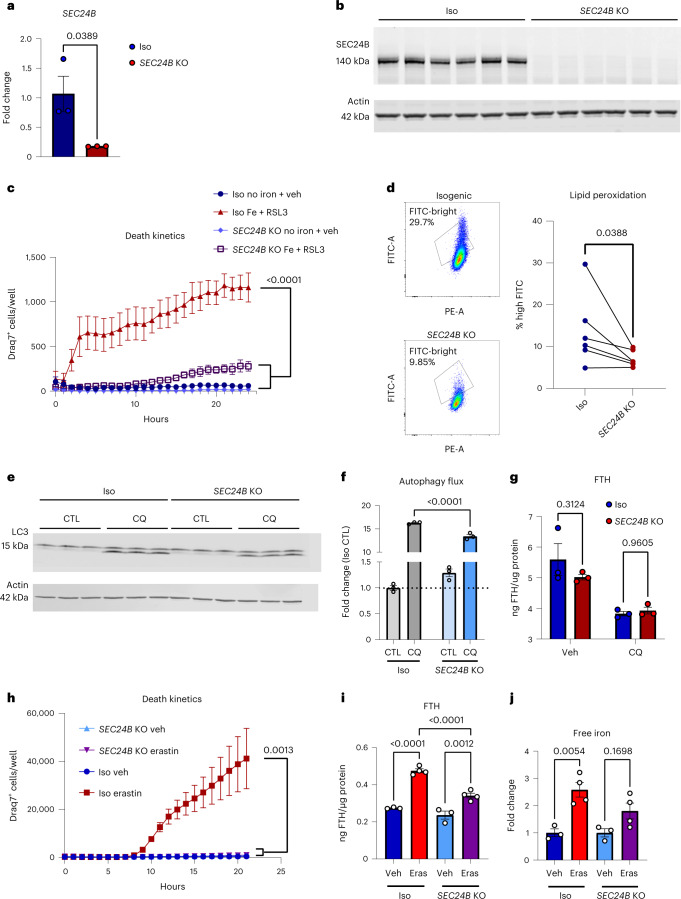
Fig. 6. SEC24B is a potent regulator of ferroptosis.
a, qRT–PCR analysis showing markedly reduced expression of SEC24B in KO line (n = 3). Unpaired t-test. P values are indicated in the graph. Error bars represent s.e.m. b, Western blot showing absence of SEC24B protein in KO line (n = 6 biologically independent samples). c, Death kinetics in SEC24B KO HAP1 cell line and isogenic control treated with vehicle (no iron + vehicle) or 1,600 µM iron + 1 µM RSL3 (iron + RSL3) (n = 3 biologically independent experiments). AUC, one-way ANOVA, Dunnett post hoc. P values are indicated in the graph. Error bars represent s.e.m. d, Lipid peroxidation in SEC24B KO HAP1 cell line and isogenic control 2–4 hours after ferroptosis treatment (n = 6 biologically independent experiments). One-tailed, paired t-test. P values are indicated in the graph. e,f, Western blot (e) and quantification of autophagy flux (ratio of LC3-II:LC3-I) (f) in SEC24B KO HAP1 cell line and isogenic control 6 hours after serum starvation and 100 µM chloroquine (CQ) treatment (n = 3 biologically independent experiments). One-way ANOVA, Tukey post hoc. P values are indicated in the graph. Error bars represent s.e.m. g, FTH ELISA in SEC24B KO HAP1 cell line and isogenic control 6 hours after serum starvation and 100 µM CQ treatment (n = 3 biologically independent experiments). Two-way ANOVA, Sidak post hoc. NS, not significant. Error bars represent s.e.m. h, Death kinetics in SEC24B KO HAP1 cell line and isogenic control treated with vehicle or 10 µM erastin (n = 3 biologically independent experiments). AUC, one-way ANOVA, Dunnett post hoc. P values are indicated in the graph. Error bars represent s.e.m. i, FTH ELISA in SEC24B KO HAP1 cell line and isogenic control 24 hours after 10 µM erastin (Eras) treatment (n = 3 for vehicle and n = 4 for Eras biologically independent experiments). One-way ANOVA, Tukey post hoc. P values are indicated in the graph. Error bars represent s.e.m. j, Free, reduced iron quantification in SEC24B KO HAP1 cell line and isogenic control 24 hours after 10 µM Eras treatment (n = 3 for vehicle and n = 4 for Eras biologically independent experiments). One-way ANOVA, Tukey post hoc. P values are indicated in the graph. Error bars represent s.e.m. CTL, control; veh, vehicle.

