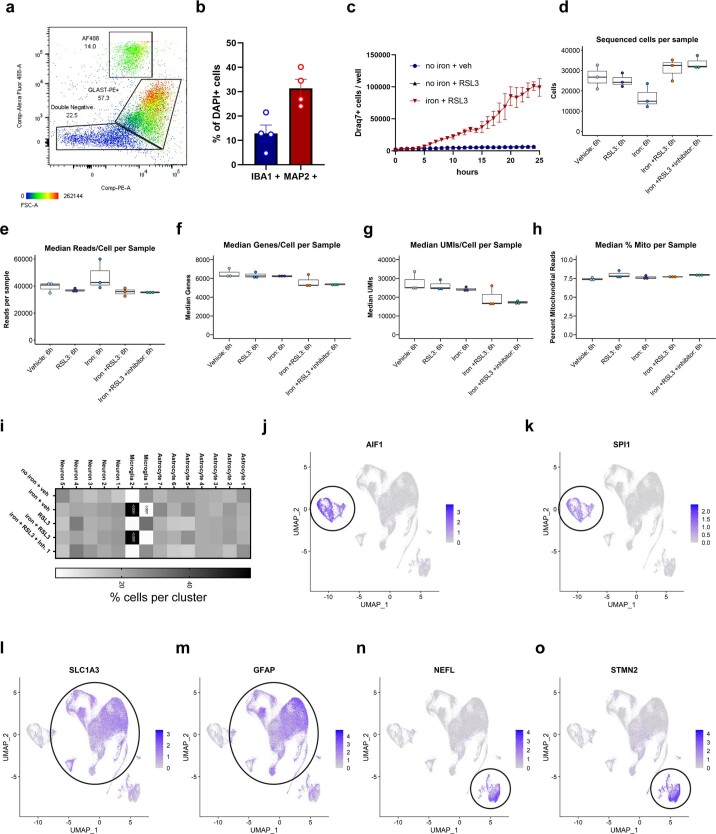
Extended Data Fig. 1. Tri-culture cell type validation and death kinetics of RSL3 only.
a, Flow cytometry analysis isolating GFP+ microglia, GLAST-PE+ astrocytes, and double-negative neurons. (n = 1). b, Quantification of percent IBA1+ and MAP2+ cells by ICC in tri-culture (n = 4 biologically independent experiments). Error bars represent SEM. c, Death kinetics of no iron + RSL3 compared to no iron + veh and iron + RSL3. (n = 3 biologically independent experiments). Error bars represent SEM. d–h, quality control for scRNAseq. Minima = minimum value, maxima = maximum value, center = median, bounds of box = 25th and 75th percentile, bounds of whisker = minima and maxima. i, Percent cells per cluster per condition. (n = 3 biologically independent experiments). Two-way ANOVA, Tukey post hoc. p-values are indicated in graph. j–o, Cell type identification of gene expression by j, k AIF1 and SPI1 for microglia, l,m SLC1A3 and GFAP for astrocytes, and n,o NEFL and STMN2 for neurons.

