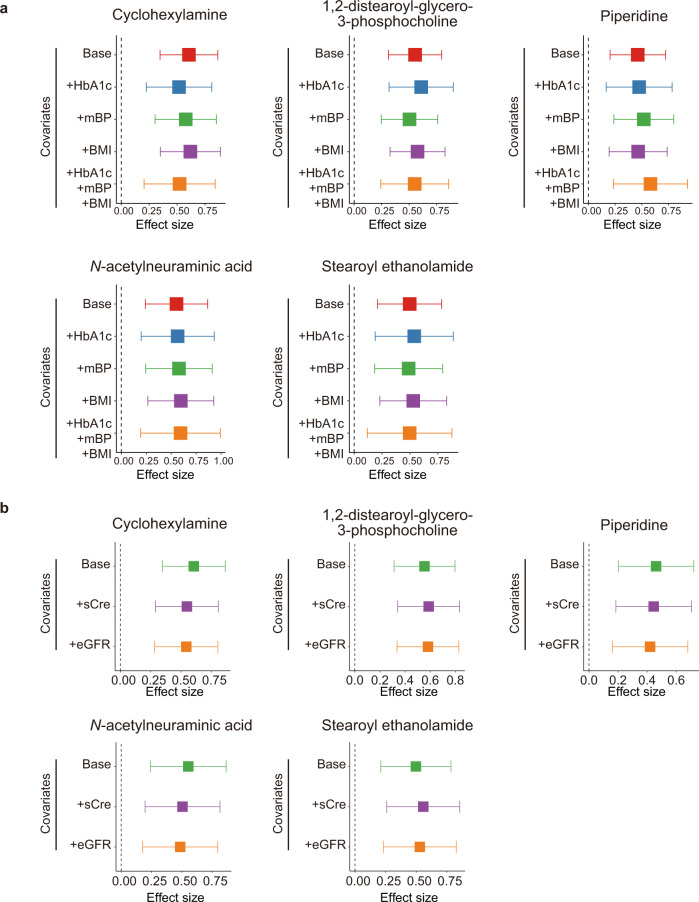
Fig. 2. Forest plots from the results of the sub-analyses for the metabolites with significant association to the complications of T2D.
The effect sizes of the sub-analyses for the metabolites with significant association to DR + DKD. The sub-analyses are performed for the a risk factors of the complications and b the markers of the renal function by logistic regression. The boxes indicate the point estimates, and the error bars indicate the 95% confidence interval. Number of the samples used for sub-analyses are following; Base, NDR + DKD = 141, Ncontrol = 159; +HbA1c, NDR + DKD = 109, Ncontrol = 112; +mBP, NDR + DKD = 131, Ncontrol = 132; +BMI, NDR + DKD = 135, Ncontrol = 147; +HbA1c+mBP+BMI, NDR + DKD = 98, Ncontrol = 93; +sCre and +eGFR, NDR + DKD = 139, Ncontrol = 157. BMI, body mass index; DKD, diabetic kidney disease; DR diabetic retinopathy; eGFR, estimated glomerular filtration rate; HbA1c, hemoglobin A1c; mBP, mean blood pressure; sCre, serum creatinine; T2D, type 2 diabetes.

