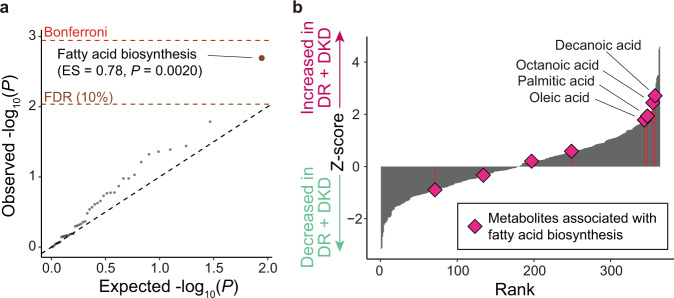
Fig. 3. Results of the metabolite set enrichment analysis.
a A quantile–quantile plot of the p values of pathways in MSEA based on the KEGG pathways. The x-axis indicates log-transformed expected p values. The y-axis indicates log-transformed observed p values. The diagonal dashed line represents y = x, which corresponds to the null hypothesis. The horizontal red dashed line indicates the Bonferroni-corrected threshold (α = 0.05), and the brown dashed line indicates the FDR threshold (FDR = 0.10) calculated with the Benjamini-Hochberg method. Pathways with p values less than the FDR thresholds are plotted as brown dots. b Bar-plot of the Z-scores in case–control association tests. The x-axis indicates the rank of the metabolites according to their Z-score. the y-axis indicates the Z-scores of the metabolites. Rhombus indicates the metabolites which are annotated as fatty acid biosynthesis-related metabolites. The number of samples used for the analysis is NDR + DKD = 141 and Ncontrol = 159. DKD, diabetic kidney disease; DR diabetic retinopathy; ES, enrichment score; FDR, false discovery rate; KEGG, Kyoto Encyclopedia of Genes and Genomes; MSEA, metabolite set enrichment analysis.

