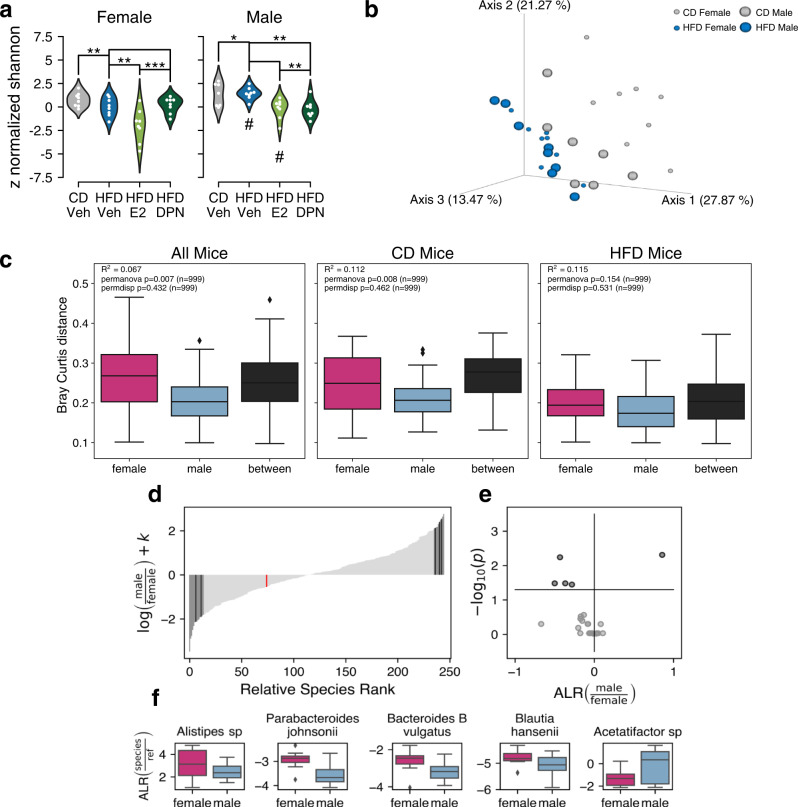
Fig. 1. Sex differences in the microbiota composition.
a Violin plots of the alpha diversity are presented with the Shannon index (male CD: n = 7, all other groups n = 8). Student’s two-tailed t-test, *P < 0.05, **P < 0.01, ***P < 0.001, # indicating significant sex difference. b PCoA plot visualizing the beta diversity with Bray–Curtis distance in males and females on CD and HFD (male CD: n = 7 all other groups n = 8). c Boxplots presenting the significance of differences in beta diversity between groups, with Bray–Curtis distance. d Histogram plot of the species rank against the log fold change difference between males and females of the full data set (n = 63, adjusted for the diet/treatment interaction), along with (e) a volcano plot showing the significantly differentially abundant species between females and males. f Boxplot of the additive-log-ratio transformed taxa visualizing the significant differentially abundant species (incl. Acetatifactor sp002490995 and Alistipes sp002428825) separated on females and males (not adjusted for covariates). The boxplots are shown as median (line), interquartile range (box), and minimum to maximum data range (whisker).

