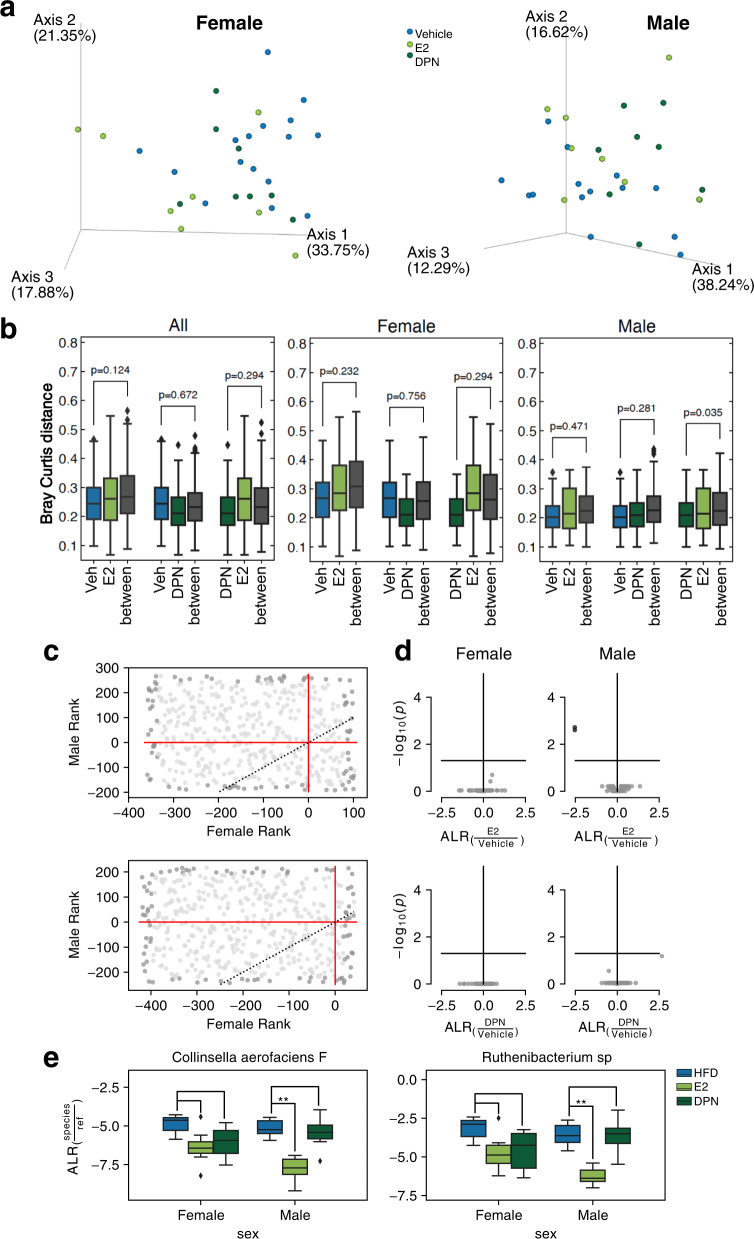
Fig. 3. Impact of estrogen treatments on the microbiota composition.
a PCoA plot visualizing the beta diversity with Bray–Curtis distance in females (n = 24) and males (n = 24) on an HFD treated with vehicle, E2, and DPN. b Boxplots presenting the significance of the beta diversity between corresponding groups (all HFD), with Bray–Curtis distance. c Scatter plots of the microbial rank in males against the microbial rank in females upon treatment with E2 (upper panel) or DPN (lower panel). The lower right corner indicates the top-ranked species in both sexes upon E2 and DPN treatment, respectively. d Volcano plots show a degree of alteration of species by E2 and DPN treatment in both sexes. e Boxplot of the additive-log-ratio transformed taxa showing the significantly altered species by E2 and DPN treatment in both sexes (n = 8 per group). The boxplots are shown as median (line), interquartile range (box), and minimum to maximum data range (whisker). **FDR < 0.01 (Benjamini–Hochberg-adjusted).

