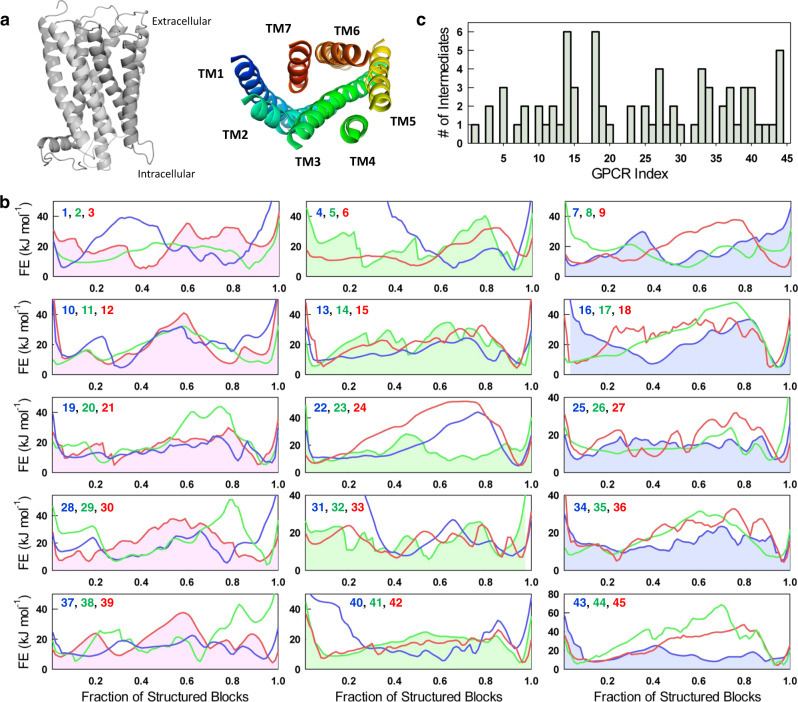
Fig. 1. GPCR free energy profiles.
a Representative structure of a GPCR with the seven transmembrane (TM) helices viewed side on (left) and from the extracellular side (right). b One-dimensional free energy (FE) profiles of the 45 GPCRs as a function of the reaction coordinate, the fraction of structured blocks, at the melting temperature. The more folded conformations populate to the right of the free energy profile (high reaction coordinate values), while the partially structured states and unfolded conformations will be populated to the left (intermediate and low reaction coordinate values, respectively). The numbers on the top left of every panel are the GPCR indices. c The number of intermediates determined from the free energy profiles in panel b assuming a 1RT threshold. Source data are provided as a Source data file.

